Figure 5.

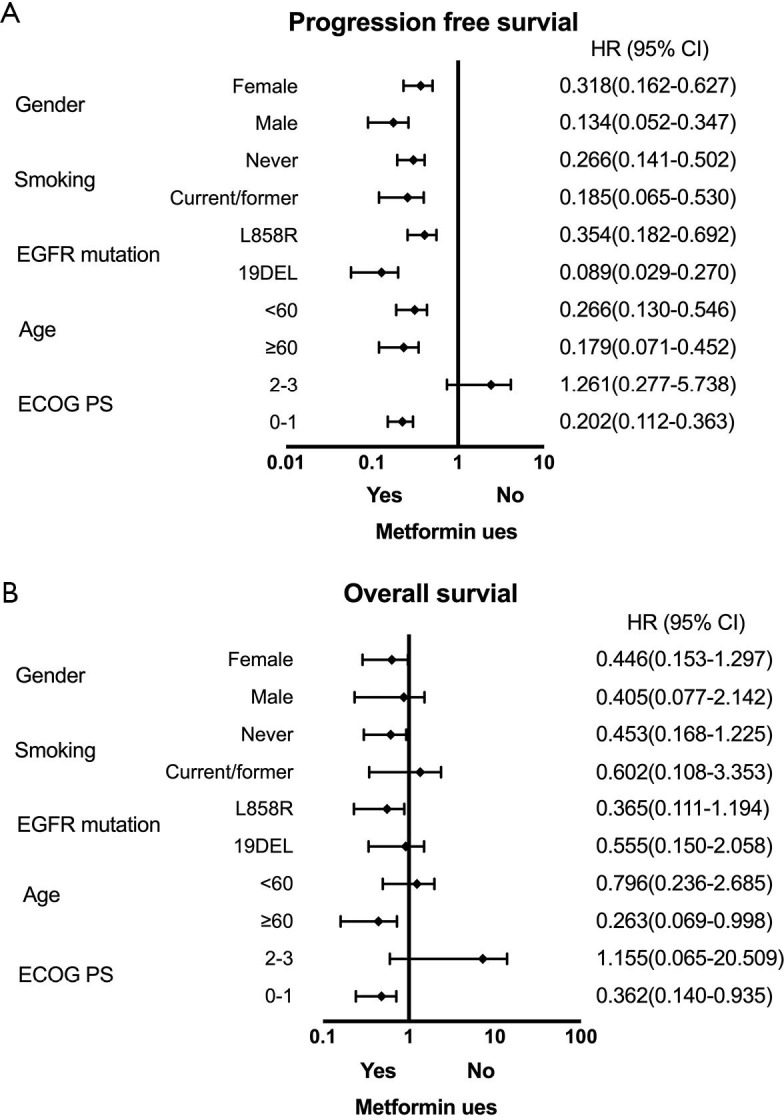
Forest plot of subgroup analysis by baseline characteristics for PFS1 (A) and OS1 (B) in patients treated with first-line EGFR-TKI and metformin.

Forest plot of subgroup analysis by baseline characteristics for PFS1 (A) and OS1 (B) in patients treated with first-line EGFR-TKI and metformin.