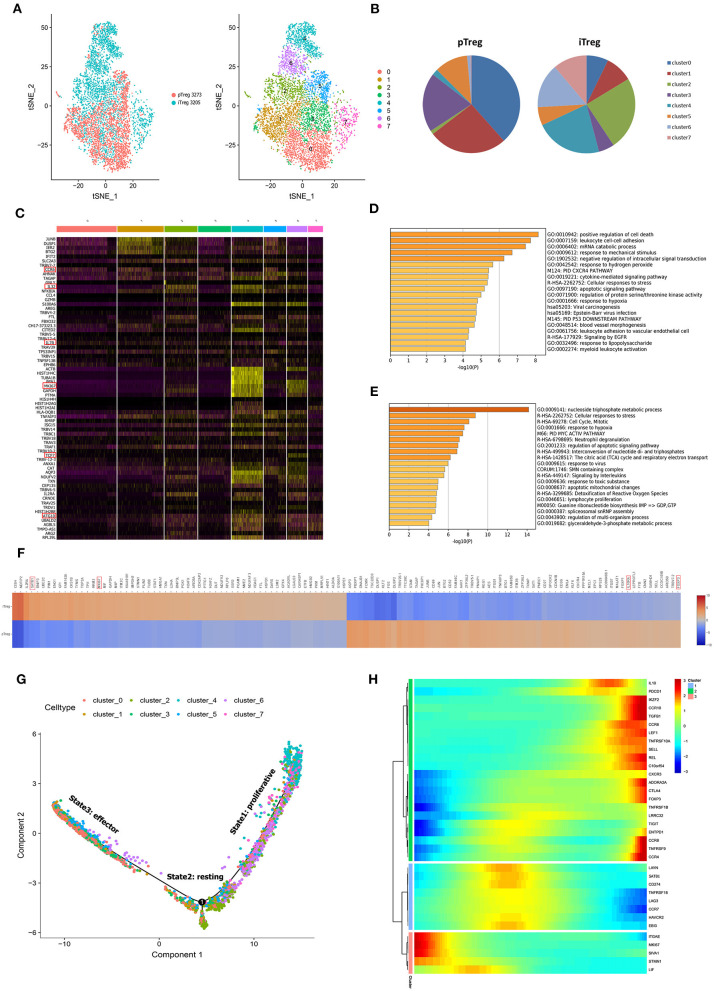
Figure 2.
Overall single-cell transcriptome characteristics of pTreg and iTreg cells. (A) The t-SNE projection of 3,273 pTreg and 3,205 iTreg cells, showing the formation of 8 main clusters. (B) PTreg and iTreg cells distribution in each clusters. (C) Heatmap showed the top 10 differential expressed genes of 8 clusters. (D,E) Functional enrichment analysis of pTreg and iTreg cells by metascape (Barplot). (F) Comparison of significantly differential expressed genes between pTreg and iTreg cells; (G) Pseudo-time development trajectories of Treg cells; (H) Changes of 35 Treg signature genes expression in pseudo-time trajectory.

