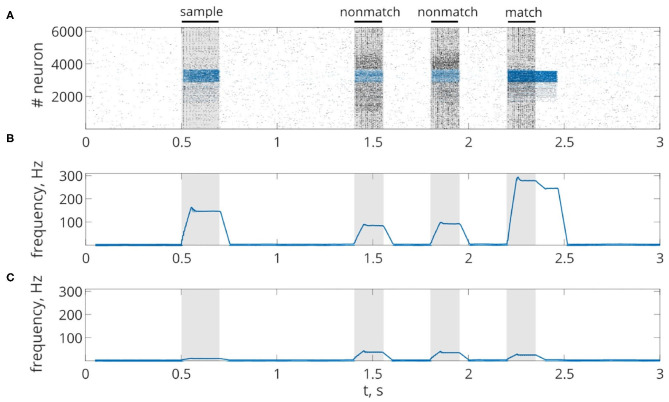
Figure 4.
Delayed matching to sample WM task. (A) One trial of the task simulated in the network. Spike raster of the neuronal network showing sample-selective delay activity. Neurons belonging to the stimulus-specific population are indicated by blue color. Black bars at the top indicate periods when each of the stimuli (training stimulus—sample, nonmatching test items—non-match, test cue—match) were presented. (B,C) The averaged firing rate of the stimulus-specific and unspecific neurons over time, respectively (20 ms bins).

