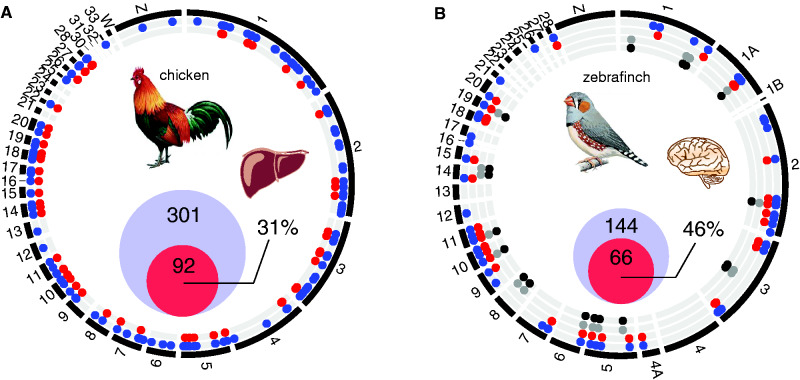
Fig. 4.
tRNA gene usage in bird genomes. Circular representation of the (A) chicken and (B) zebra finch genome. Each chromosome is proportionally scaled to its length. Tracks inserted in the circle represent the genomic location of annotated (blue) and H3K4me3-marked genes in chicken liver and zebra finch brain (red). In zebra finch, we annotated TE-associated tRNA genes (grey), which were marked by H3K4me3 (black). Two-way Venn diagrams show the proportional diameter of annotated (blue) and H3K4me3-marked tRNA genes (red). The percentage of H3K4me3-marked tRNA genes is depicted. Chromosome W in zebra finch has not been assembled.

