Fig. 5.
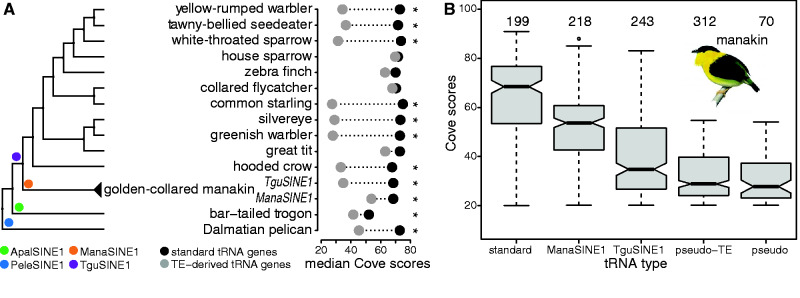
Evolution of TE-associated tRNAs. (A) Right: phylogenetic tree displaying bird genomes with detectable TE-derived tRNA genes. Presence of branch-specific TEs is highlighted at the root of the clades (circles in different colors) and the name of the SINEs giving rise to TE-derived tRNA genes (legend bottom left). Left: median Cove scores of standard (black circle) and TE-derived (grey circle) tRNA genes per species are shown. Asterisks highlights significantly lower median Cove scores of TE-associated tRNA genes compared to standard tRNA genes. (B) Boxplots show decrease of Cove scores from standard tRNA genes to pseudogenes in the golden-collared manakin genome. ManaSINE1-associated tRNA genes have a higher Cove score than TguSINE1-associated tRNA genes because they appeared later in the phylogenetic history and thus accumulated fewer mutations. Numbers above each box entail the total gene number interrogated per tRNA type.

