Fig. 6.
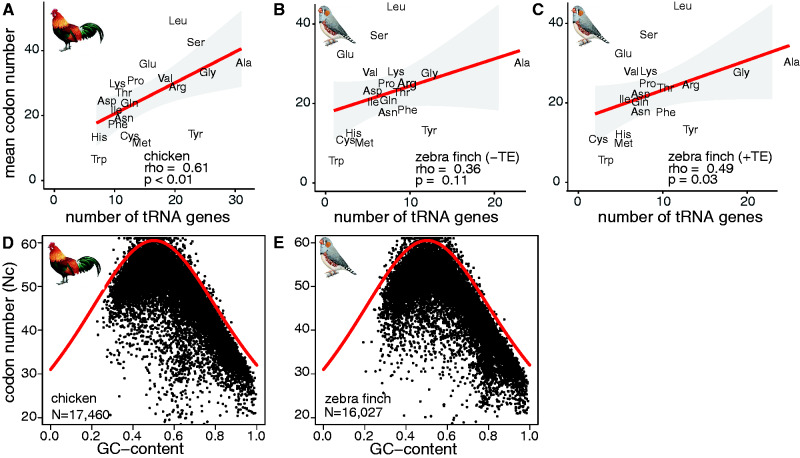
Codon usage correlates with tRNA gene number and transcriptomic GC content in birds. Amino acid usage in codons of protein-coding genes (y-axis) are plotted against the number of tRNA genes per isotype (abbreviated by three-letter code) (x-axis) for (A) chicken, (B) zebra finch without (–TE), and (C) with (+TE) TE-associated tRNA genes. Regression (red line), 95% confidence interval (grey area), Spearman’s rank correlation coefficients (rho) and P values (P) are shown. For (D) chicken and (E) zebra finch, the effective number of codons (Nc) per protein-coding gene (N, y-axis) (black points) is plotted against the proportional GC content at the third codon position (x-axis). The red curve indicates the expected relationship if mutational biases affect codon usage.

