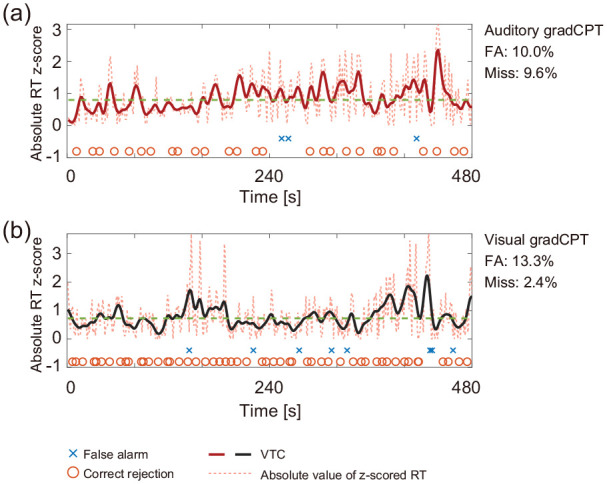
Figure 2.

Time courses of the auditory and visual gradCPTs from a representative participant. (a and b) The reflected time course (bold line) of sustained attention. It was derived from z-scored RTs (dotted line) and smoothed. A larger value indicates a more variable state. The horizontal dashed line shows the median value of the VTC. The data are derived from Experiment 2.
VTC: variance time course.
