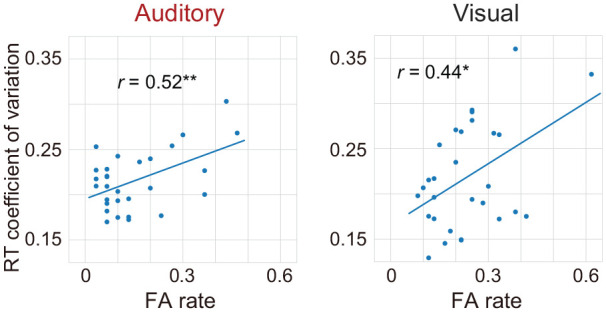
Figure 7.

Individual differences in the relationship between the FA rate and the stability of RTs. Correlations between the FA rate and RT coefficient of variation are significant (p < .05). Circles indicate individual data points in the auditory and visual gradCPTs.
