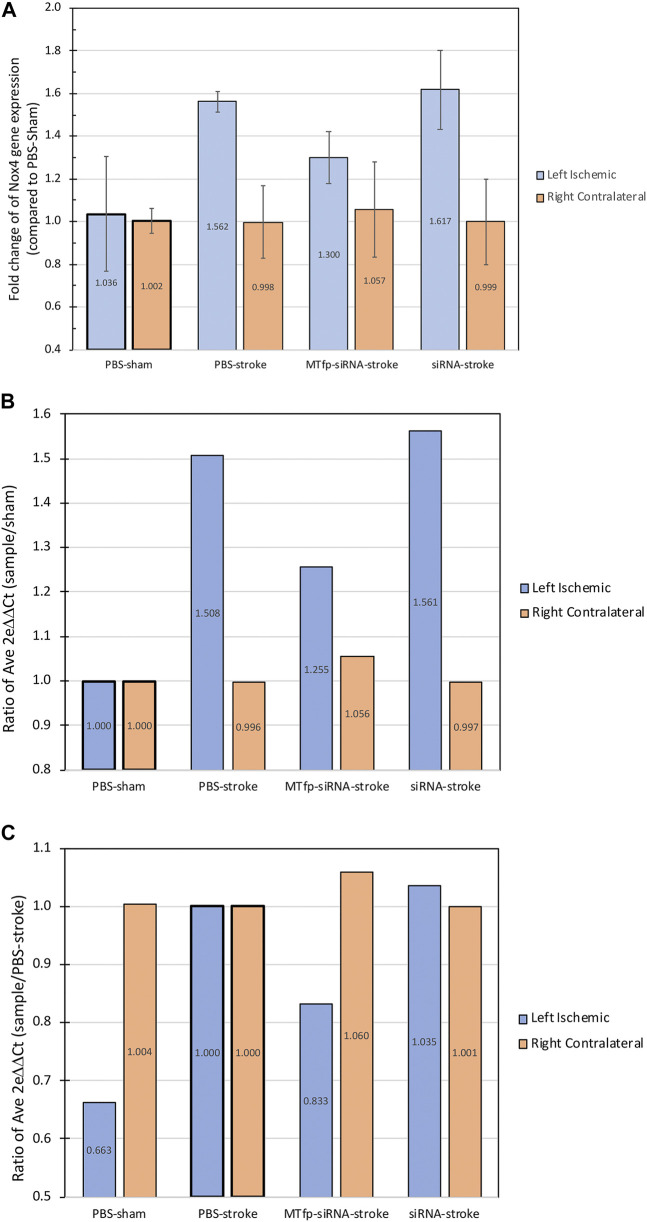
FIGURE 3.
NOX4 mRNA expression in the brain after siRNA treatment. The graphs show the fold change of Nox4 gene expression in the mouse brain hemispheres measured by qPCR following treatment and 24 h post-stroke, showing both the expression in left ischemic side and the right contralateral side. (A) Values are normalized to β-actin gene expression and individual samples are compared to the corresponding average PBS-sham condition (ischemic or contralateral). Data are shown as mean ± SEM. (n = 2–4 mice per group). (B) Ratio of average fold change of each group compared to PBS-sham. (C) Ratio of average fold change of each group compared to PBS-stroke. “Left ischemic” in blue, refers to the measurments in the left stroke-induced hemisphere and “Right contralateral” in orange, refers to the measurement in the right non-stroke hemisphere. Raw data and calculations are shown in Supplementary Table S3.

