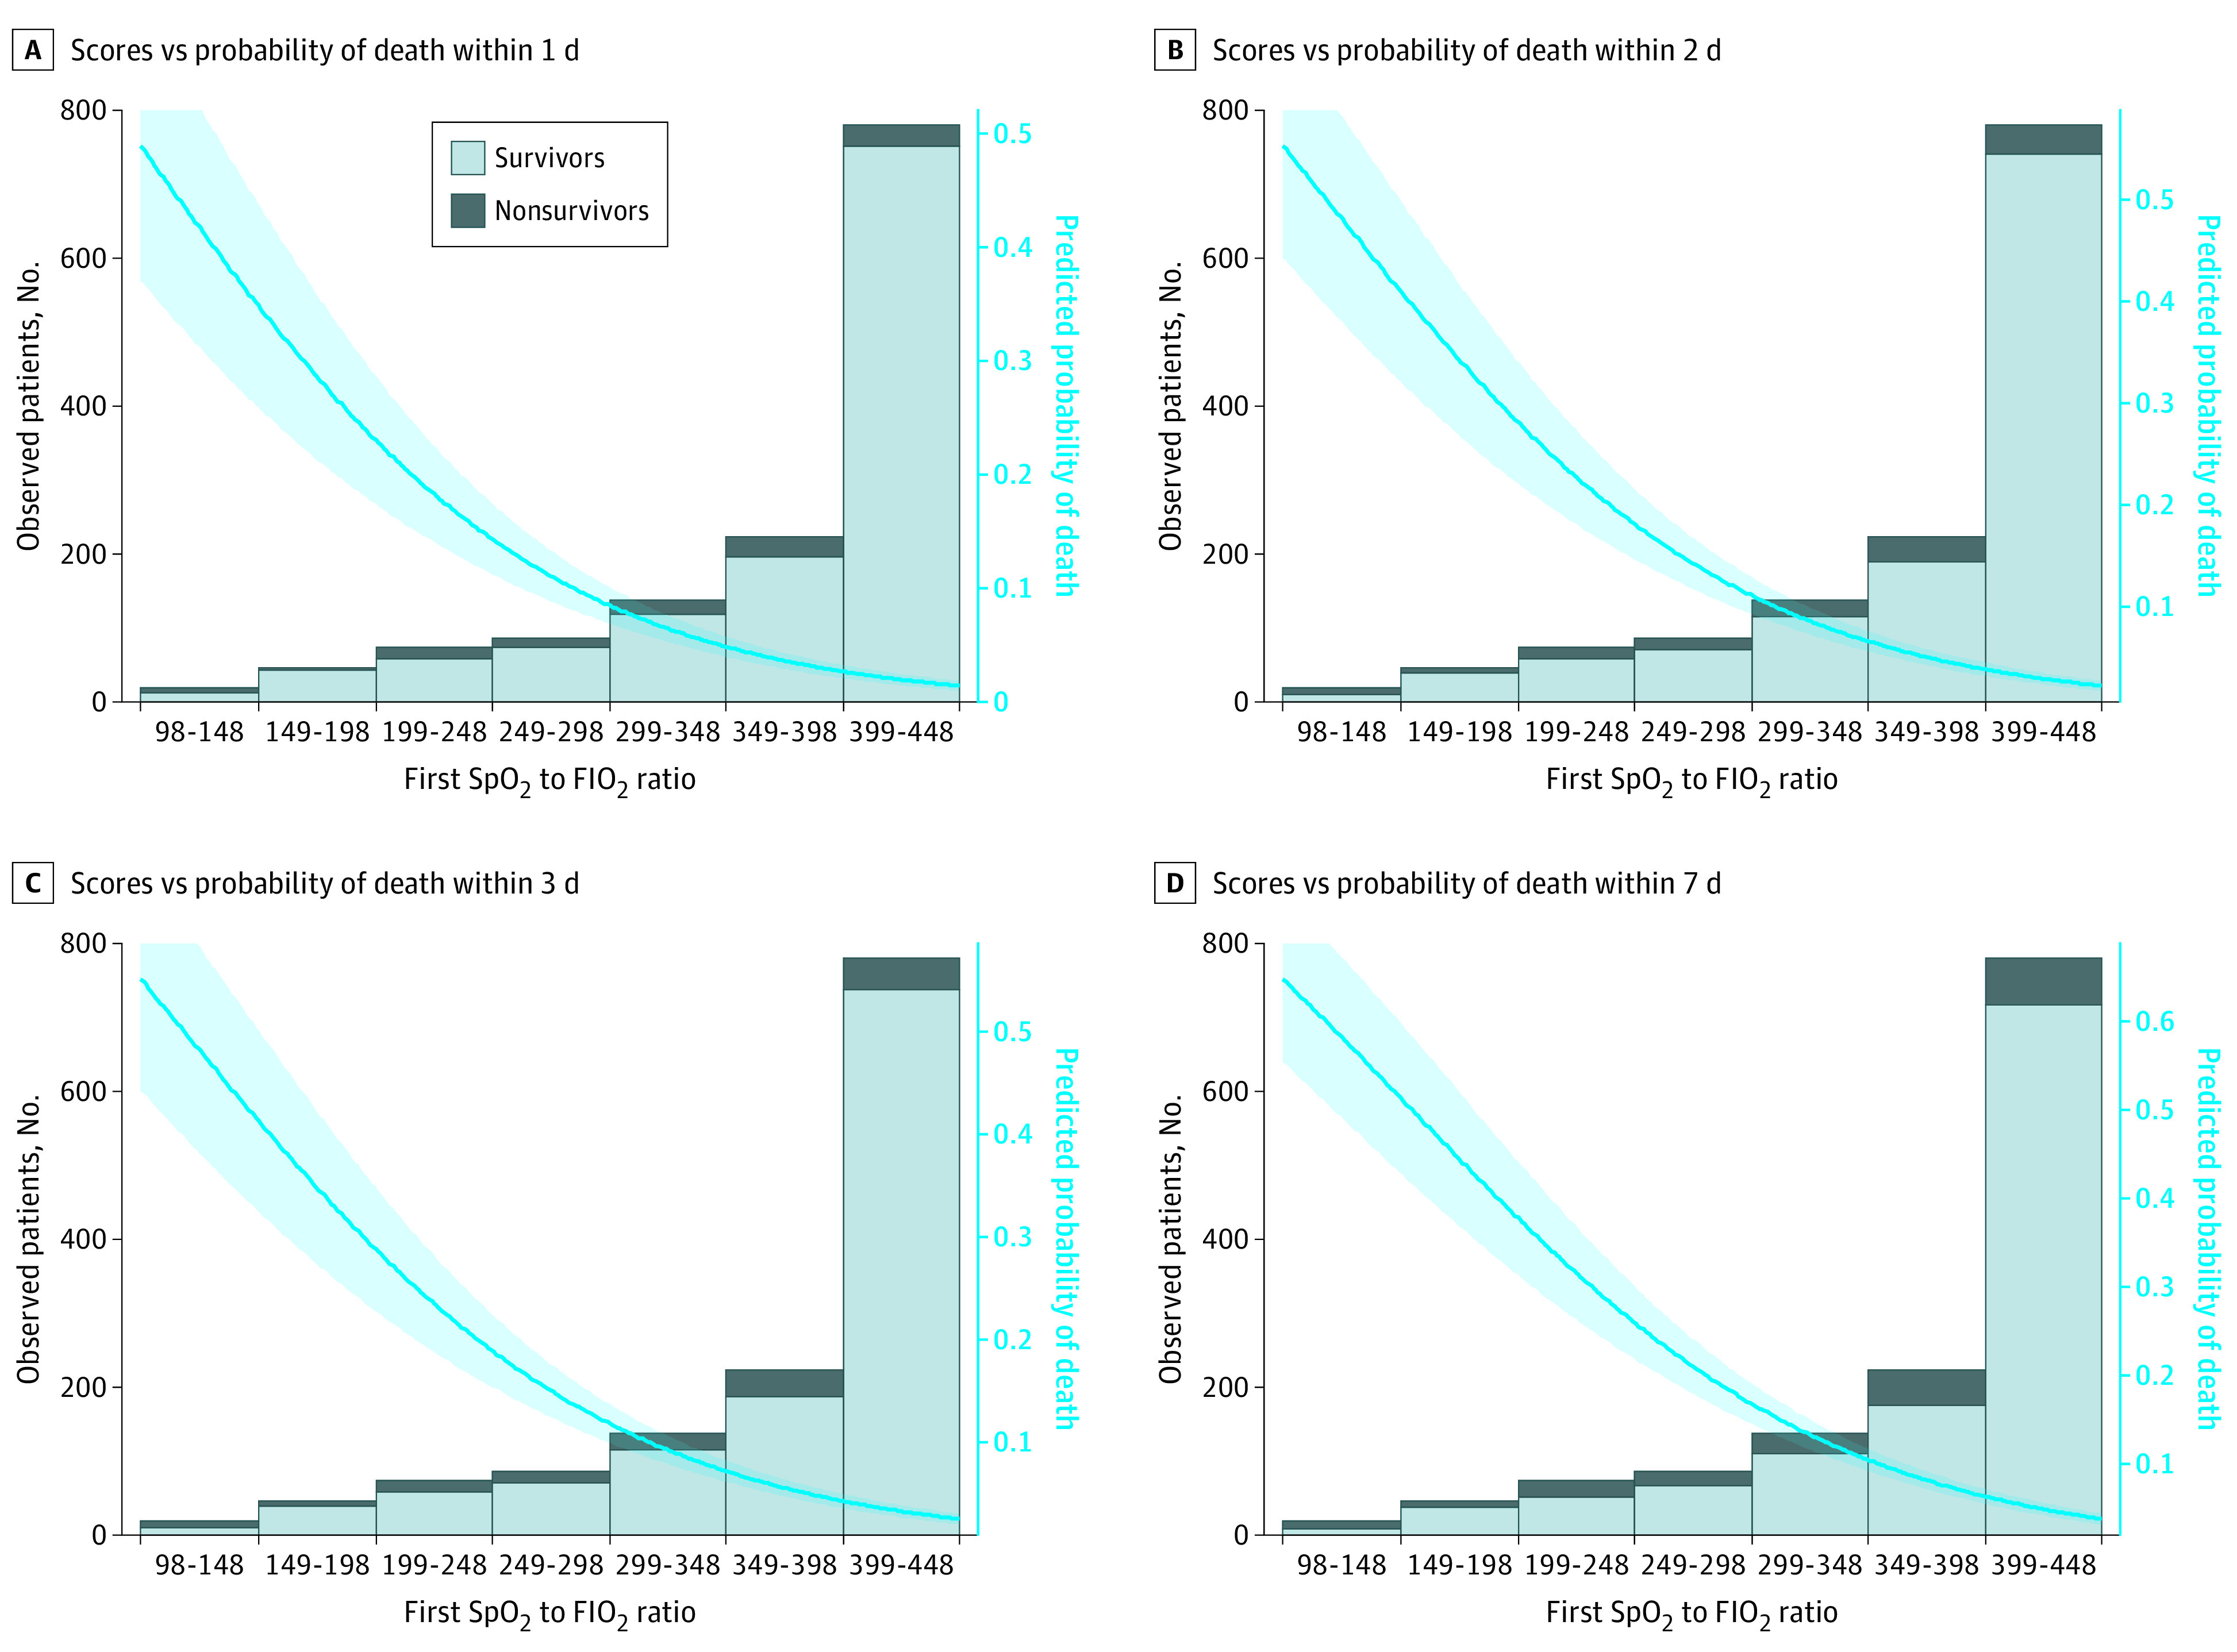
Figure 2. First Spo2 to Fio2 Ratio Scores vs Real and Predicted Probability of Death.

A, Scores vs probability of death within 1 day. B, Scores vs probability of death within 2 days. C, Scores vs probability of death within 3 days. D, Scores vs probability of death within 7 days. The shaded area outside the trend line corresponds to the 95% CI of the predicted probability of death. Fio2 indicates fraction of inspired oxygen; Spo2, oxygen saturation as measured by pulse oximetry.
