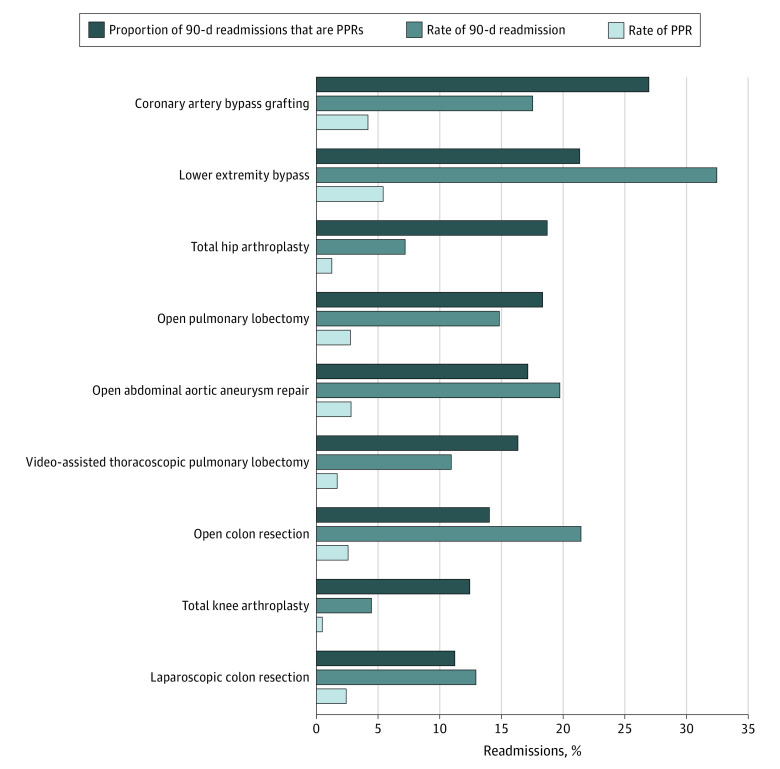
Figure 3. Procedure-Specific Rates of Potentially Preventable Readmissions (PPRs) and 90-Day Readmissions and the Proportion of Total 90-Day Readmissions Due to Potentially Preventable Causes.
Procedures are ordered from top to bottom, with decreasing proportion of readmissions due to potentially preventable causes.

