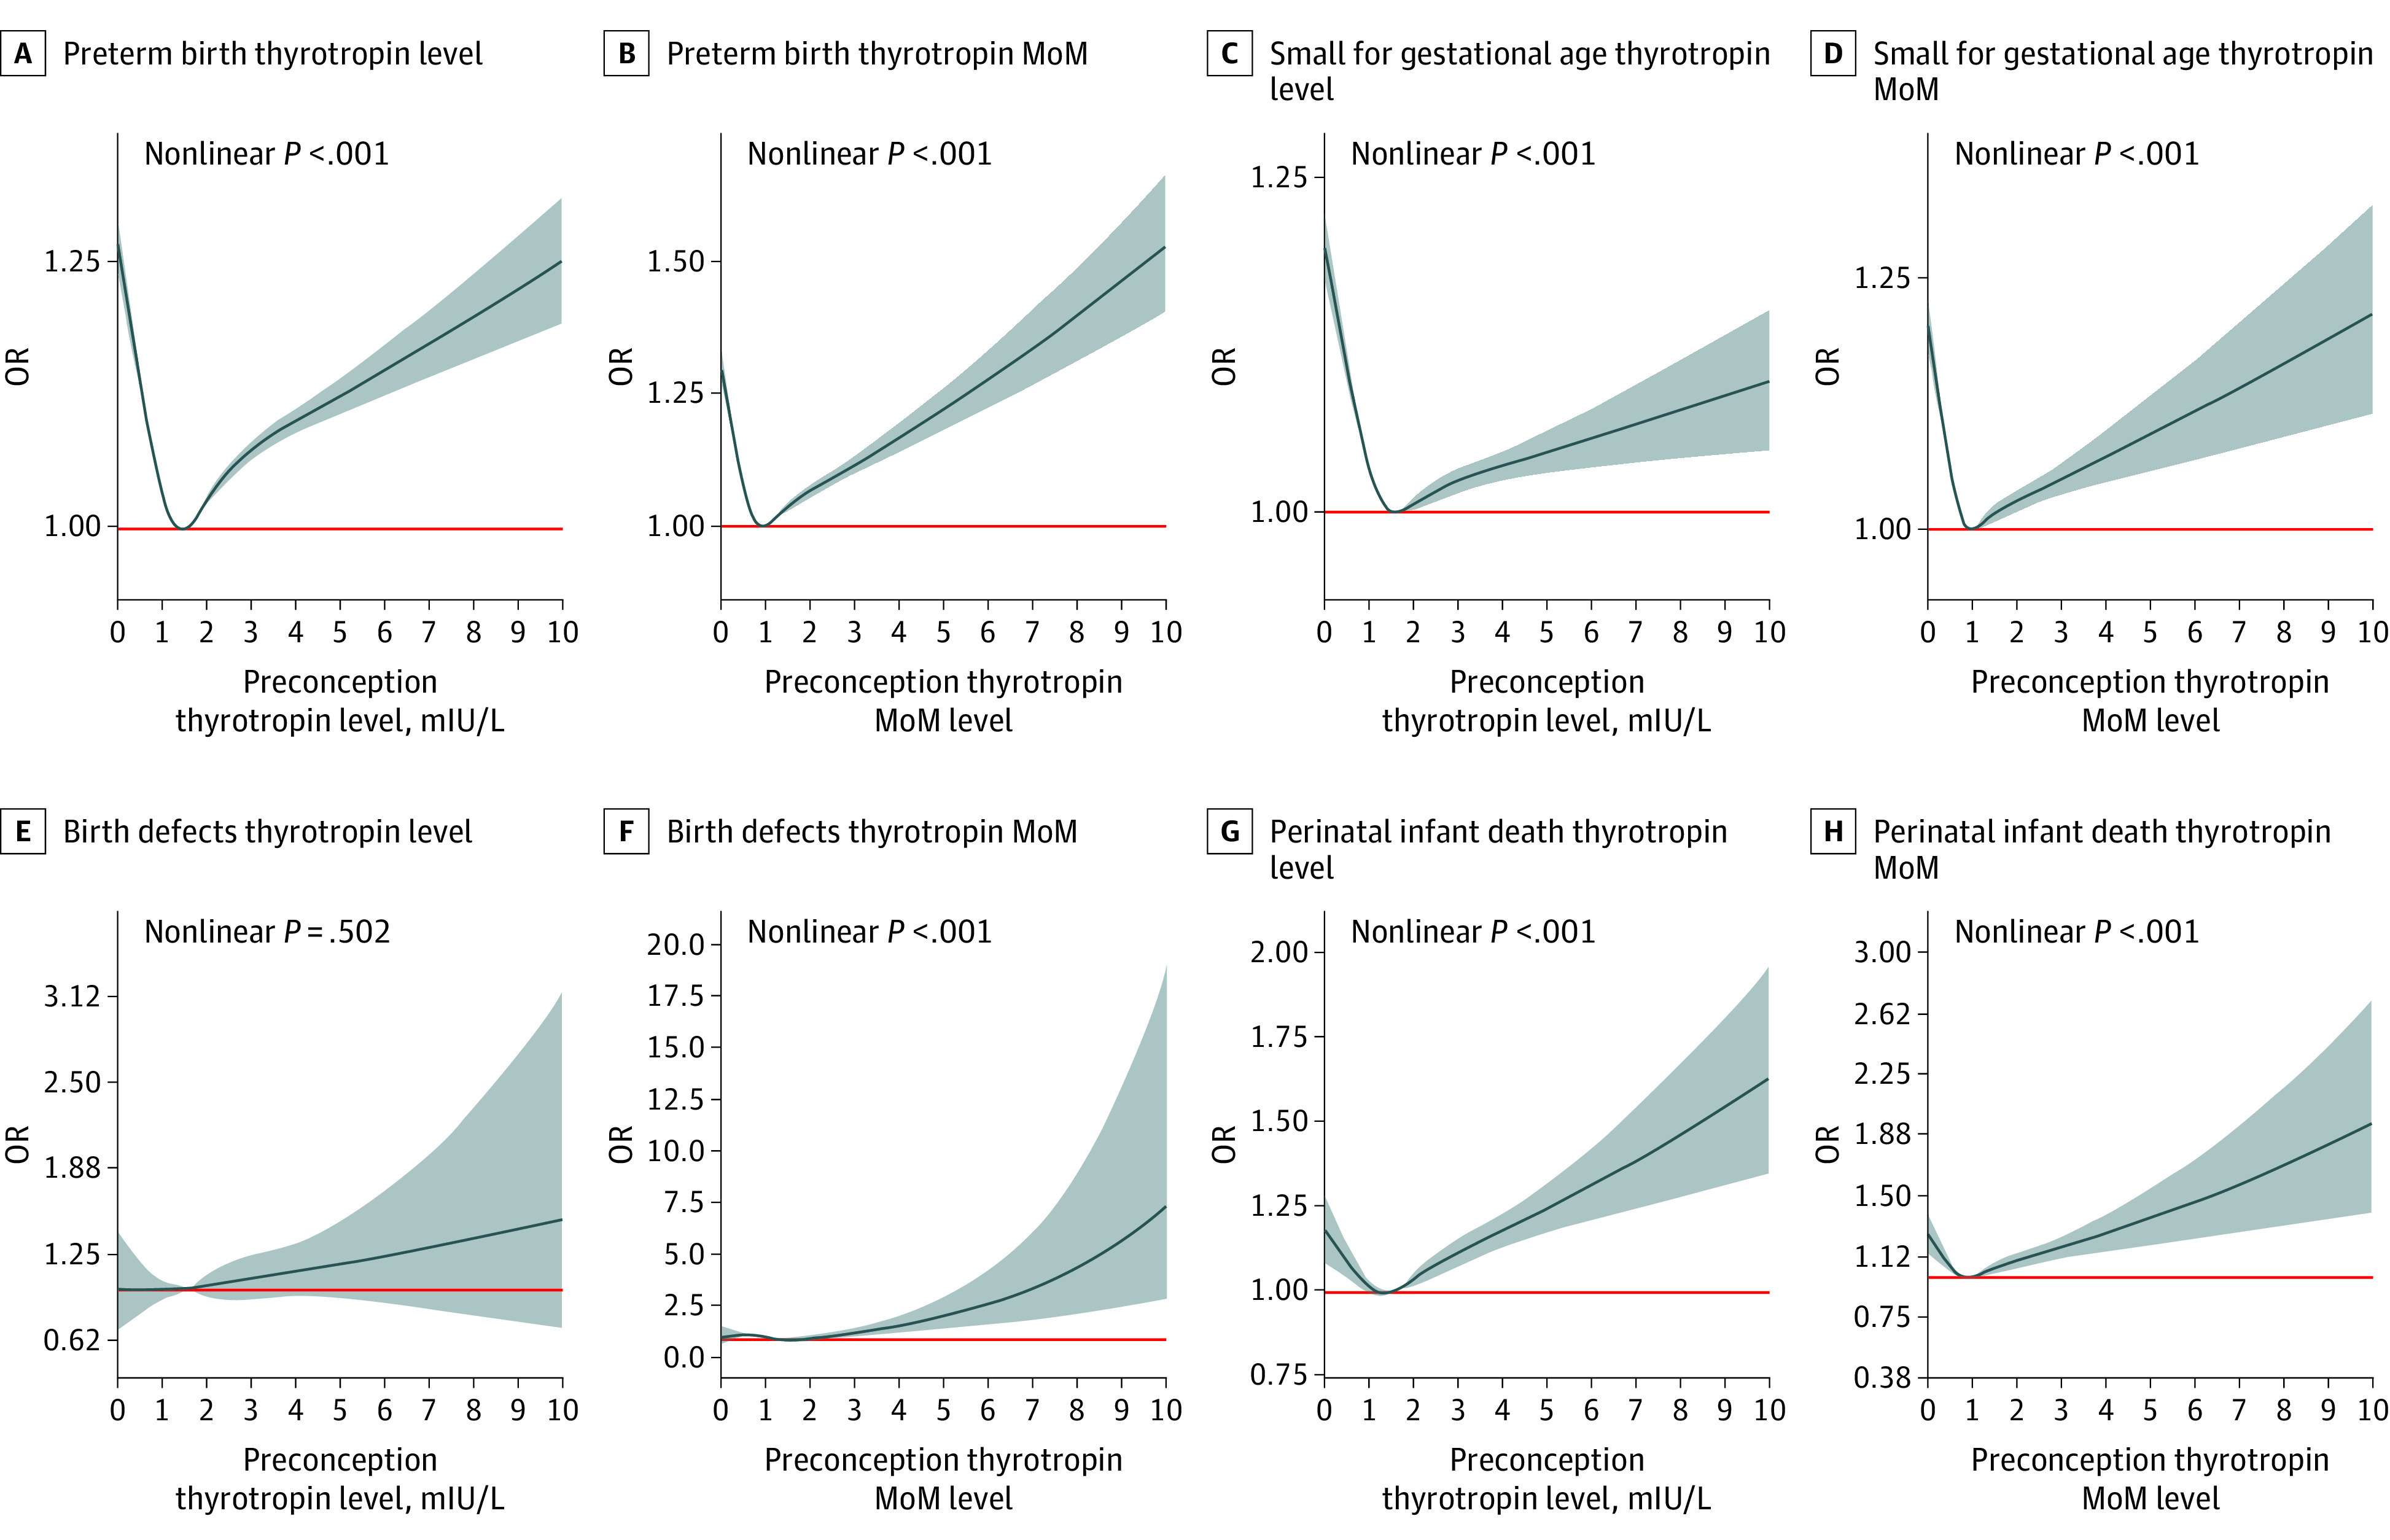
Figure 3. Dose-Response Relationship Between Maternal Preconception Thyrotropin or Thyrotropin Multiples of the Median (MoM) and the Risk of Adverse Pregnancy Outcomes.

The multivariable-adjusted odds ratios (ORs) are shown for the associations between maternal preconception thyrotropin levels or thyrotropin MoM values and the risk of preterm birth (A, B), small for gestational age (C, D), birth defects (E, F), and perinatal infant death (G, H). Dark blue curves and shaded gray areas show predicted ORs and 95% CIs, respectively. Maternal age at last menstrual period, higher education, area of residence, body mass index, alcohol drinking, passive smoking, history of thyroid disease, hypertension, diabetes, and history of adverse pregnancy outcomes were used in the analysis as covariates. The red lines represent the reference level. (A: thyrotropin = 1.50 mIU/L, OR = 1; B: thyrotropin MoM = 0.90, OR = 1; C: thyrotropin = 1.65 mIU/L, OR = 1; D: thyrotropin MoM = 0.95, OR = 1; E: thyrotropin = 0.90 mIU/L, OR = 1; F: thyrotropin MoM = 1.45, OR = 1; G: thyrotropin = 1.36 mIU/L, OR = 1; and H: thyrotropin MoM = 0.90, OR = 1).
