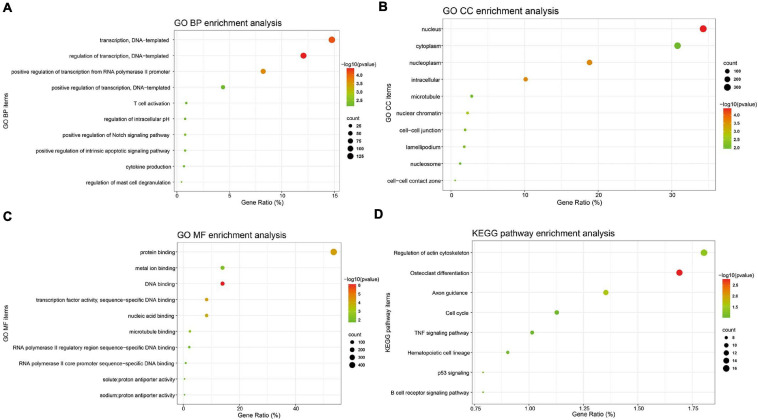
FIGURE 2.
GO annotation and KEGG pathway enrichment analysis of DE-mRNAs. GO functional annotation analysis and KEGG pathway enrichment analysis of these 1,063 DE-mRNAs was performed by the DAVID database. The top 10 enriched GO BP (A), CC (B), and MF (C) items, and the enriched KEGG pathways (D) were displayed. Y-axis: name of GO item or the KEGG signaling pathway; X-axis: percentage of the number of genes assigned to a term among the total number of genes annotated in the network; Bubble size, number of genes assigned to a pathway; Color: enriched -log10(P-value); Red bubble: indicates a greater significance level.

