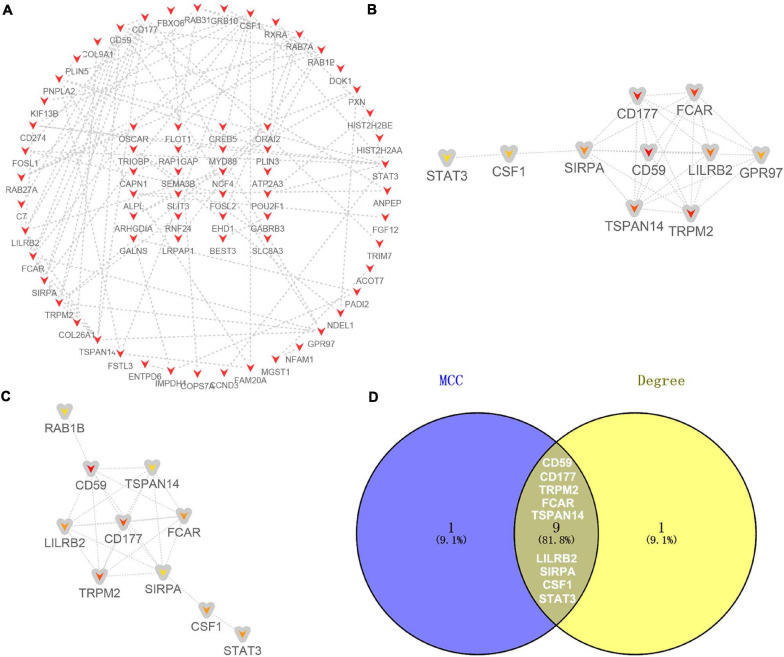
FIGURE 7.
Identification of hub genes for the candidate target genes corresponding to downregulated DE-miRNAs. (A) PPI network constructed with all the 130 candidate target genes of upregulated DE-miRNAs were performed using the STRING. The nodes represent proteins, and the edges represent the interaction of the proteins. Red, upregulation. Cytohubba in Cytoscape was used to find the top 10 hub genes in the PPI network by two analysis methods, namely, MCC (B), and Degree (C). PPI network of the top 10 hub genes was visualized by Cytoscape, and the top 10 hub genes are displayed from red (high MCC/Degree value) to yellow (low MCC/Degree value). (D) The overlapping hub genes in top 10 by the two topological methods.

