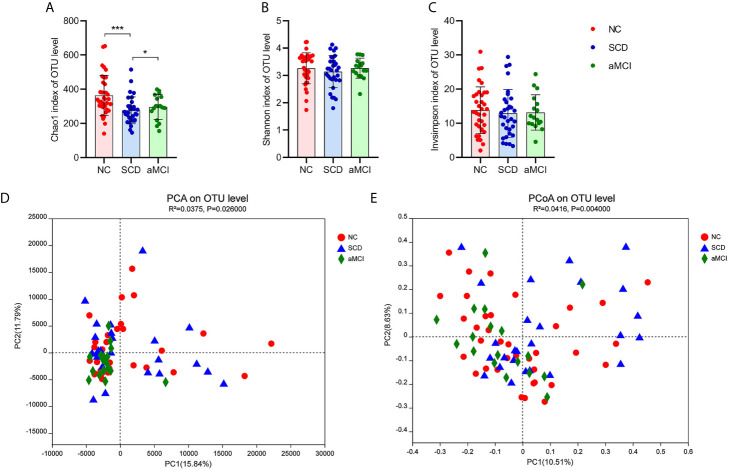
Figure 1.
(A–E) Alpha and Beta diversity analysis in intestinal flora between different cognitive groups. (A–C) The X axis and the Y axis represent the groups and alpha diversity indices respectively. And the error bar means the standard deviation. Wilcoxon rank-sum test showed that the differences in chao1 index among the three groups were significant at the OTU level (*P-value < 0.05, ***P-value < 0.005, Wilcoxon rank sum test), which meant that the species richness of intestinal flora in the SCD group was lower than in the other two groups. Shannon and inverse Simpson indices were not different significantly among three groups, which indicated that the species evenness of intestinal flora was not obvious different between three groups (P-value > 0.05, Wilcoxon rank sum test). (D, E) The X axis and the Y axis represent two selected principal coordinate axes, and the percentage represent the interpretation value of the principal coordinate axis for the difference in sample composition. Each point represents a sample, whereas red circle, blue triangle, and green square represent the NC, SCD, and aMCI groups respectively. The closer the two sample points are, the more similar the species composition of the two samples is. Beta-diversity analysis results showed that the species composition in three groups was obvious different from each other. PCA and PCoA analysis both indicated that ANOSIM test results had a significant P value (PCA analysis: R2 = 0.0375, P = 0.026; PCoA analysis: R2 = 0.0416, P = 0.004).

