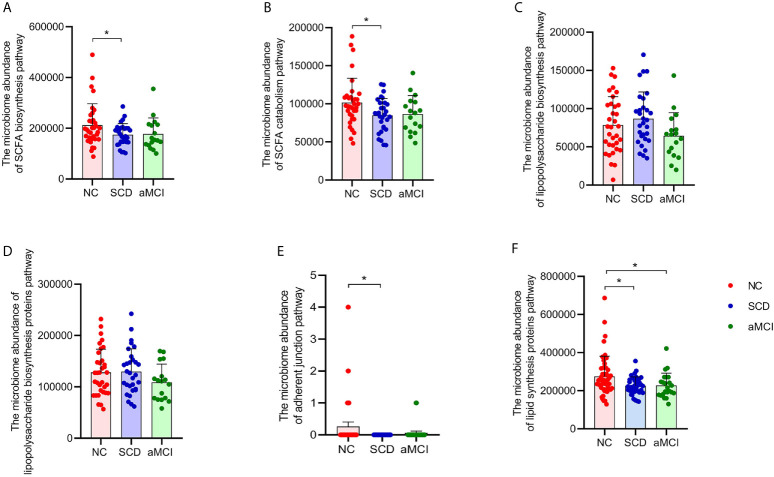
Figure 3.
(A–F) Prediction analysis in intestinal flora between different cognitive groups. PICRUST compared the KEGG database to get the microbiome abundance of each metabolic pathway at KEGG pathway level 3. The Y axis and the X axis represent the intestinal abundance of each metabolic pathway at KEGG pathway level 3 and groups respectively, and the error bar means the standard deviation. The columns with red, blue, and green colors represent the NC, SCD, and aMCI groups respectively. Wilcoxon rank sum test showed that there were higher abundance of three metabolic pathways in NC group than those in SCD group (*P-value < 0.05, Wilcoxon rank sum test), including short-chain fatty acid biosynthesis (KEGG pathway id: ko00061; (A) and catabolism (KEGG pathway id: ko00071; (B) and adherent junction (KEGG pathway id: ko04520; (E). There was insignificant difference between three cognitive groups in lipopolysaccharide biosynthesis (KEGG pathway id: ko00540; (C) and lipopolysaccharide biosynthesis proteins (KEGG pathway id: ko00541; (D) (*P-value < 0.05, Wilcoxon rank sum test). And Lipid biosynthesis proteins (KEGG pathway id: ko00537; (F) were lower in SCD and aMCI group compared with NC group (P = 0.018 and 0.027; Wilcoxon rank sum test).

