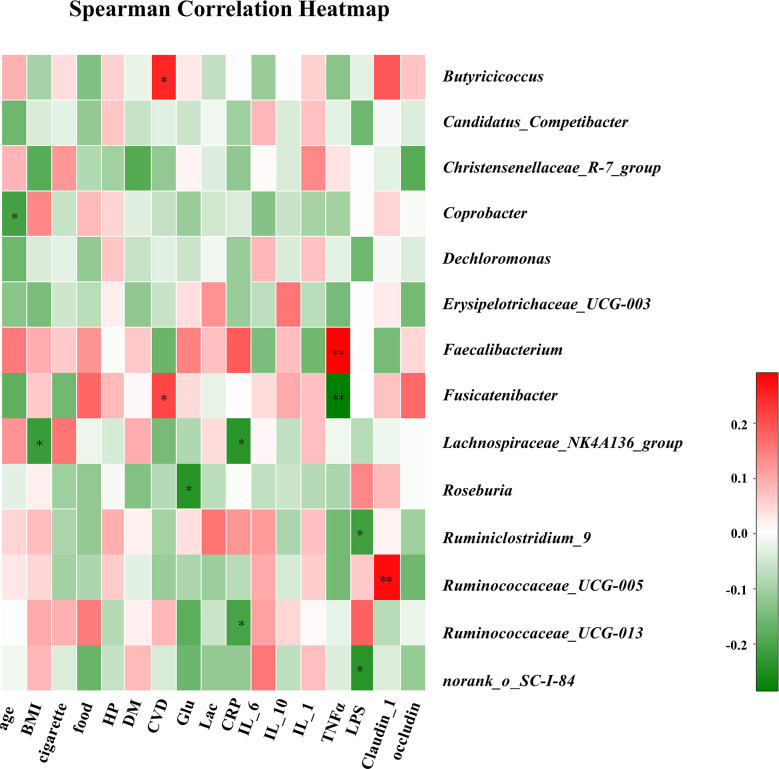
Figure 4.
Correlation analysis of clinical parameters and gut microbiota. The association between 17 clinical parameters and significant bacterial genera with altered abundances among the three groups is estimated using the heat map of Spearman’s correlation analysis. Color intensity represents the magnitude of correlation. Red, positive correlations; Green, negative correlations. P-value < 0.05, **P-value < 0.01.

