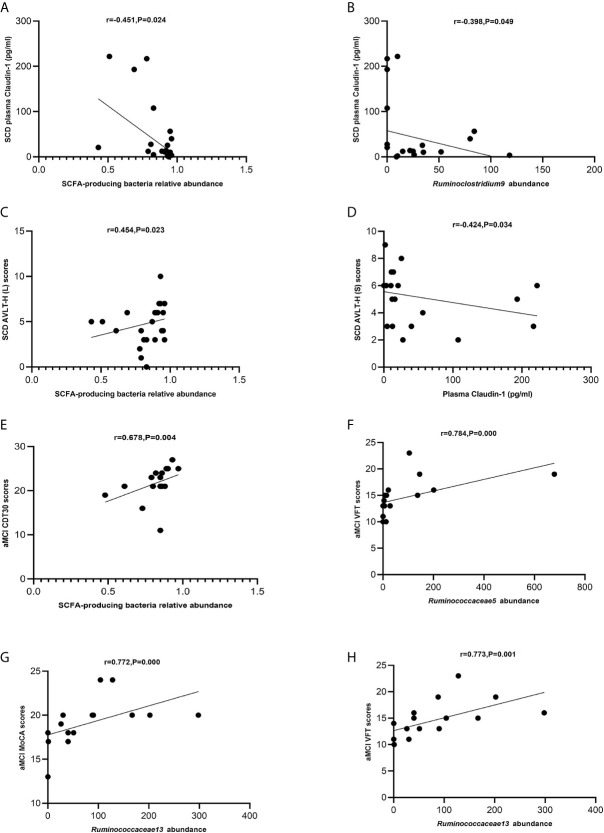
Figure 7.
(A–H) Spearman’s correlation analysis between SCFA-producing bacteria and tight junction proteins and neuropsychological assessment of pAD groups. (A) Spearman’s correlation analysis outcome shows that the concentration of plasma claudin-1 was negatively correlated with the relative abundance of the SCFA-producing bacteria in the SCD group (r = −0.451, P = 0.024; Linear regression equation: Y = −224.0*X + 224.5, P = 0.0229). (B) Spearman’s correlation analysis outcome shows that the concentration of plasma claudin-1 was negatively correlated with the relative abundance of the SCFA-producing bacteria Ruminoclostridium9 in the SCD group (r = −0.398, P = 0.049; Linear regression equation: Y = −0.5602*X + 57.64, P = 0.0962). (C) Spearman’s correlation analysis between the relative abundance of SCFA-producing bacteria and AVLT-H (L) scores in the SCD group (r = 0.454, P = 0.023; Linear regression equation: Y = 3.847*X + 1.610, P = 0.2345). (D) Spearman’s correlation analysis between the concentration of plasma caludin-1 and AVLT-H (S) scores in the SCD group (r = 0.424, P = 0.034; Linear regression equation: Y = −0.008021*X + 5.555, P = 0.1623). (E) Spearman’s correlation analysis between the relative abundance of SCFA-producing bacteria and CDT30 in the aMCI group (r = 0.678, P = 0.004; Linear regression equation: Y = 12.68*X + 11.33, P = 0.1302). (F) Spearman’s correlation analysis between the relative abundance of SCFA-producing bacteria Ruminococcaceae5 and VFT scores in the aMCI group (r = 0.784, P= 0.000; Linear regression equation: Y = 0.01098*X + 13.63, P = 0.0359). (G) Spearman’s correlation analysis between the relative abundance of the SCFA-producing bacteria Ruminococcaceae13 and MoCA-B scores in the aMCI group (r = 0.772, P = 0.000; Linear regression equation: Y = 0.01652*X + 17.76, P = 0.0368). (H) Spearman’s correlation analysis between the relative abundance of the SCFA-producing bacteria Ruminococcaceae13 and VFT scores in the aMCI group (r = 0.773, P = 0.001; Linear regression equation: Y = 0.02425*X + 12.65, P = 0.019).

