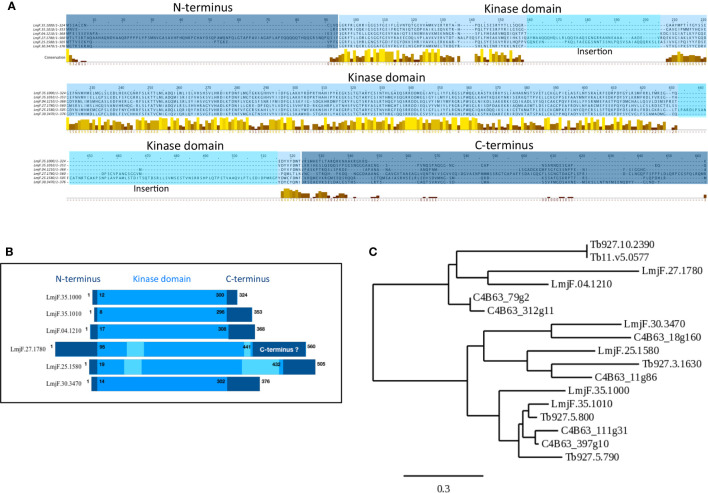
Figure 1.
Visualization of conserved CK1 regions and phylogenetic analysis. (A) Multiple sequence alignment of the Leishmania CK1s ( Table 1 ) was generated using the T-COFFEE Server (http://tcoffee.crg.cat (Notredame et al., 2000)). The dark blue corresponds to the N- and C-termini; the lighter blue corresponds to the kinase domain; and the lightest blue corresponds to insertions in the catalytic domain. The conserved amino acids were visualized by Jalview; the color code is as follows, low level of amino acid conservation (dark brown) to highly level of conservation (yellow) (https://www.jalview.org (Waterhouse et al., 2009)). (B) Schematic representation of the domain organisation of the different Leishmania CK1s, see A for the color code. (C) Phylogenetic tree of all the trypanosomatid CK1s described in the text (see Table 1 ) obtained using the http://www.phylogeny.fr server (Dereeper et al., 2008). The bar represents an evolutionary distance of 0,3%.

