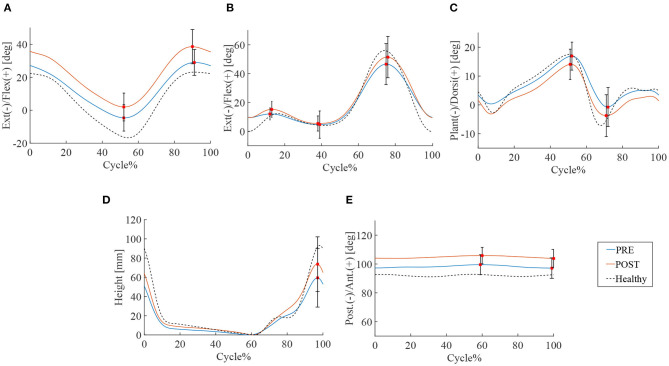
Figure 2.
Gait kinematics of chronic stage patients. Blue line is the mean of patients' joint angle before HAL intervention, the red line is post HAL intervention, and the dotted line is gait analysis plot for percentage of walking cycle represents the normalized time. (A) Hip joint. (B) Knee joint. (C) Ankle joint. (D) Toe lift. (E) Pelvis.

