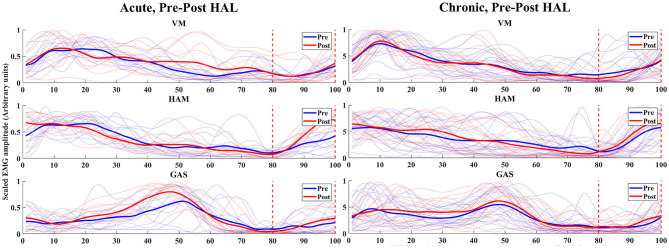
Figure 4.
EMG (VM, HAM, and GAS) of acute and chronic stage patients, pre and post HAL intervention – The normalized time correspond to the percentage of walking cycle. The blue and red lines shows pre and post HAL intervention plots of each subject's EMG, respectively. The solid blue and red lines are mean plots of all subject's pre and post HAL intervention in the group, respectively. Eighty percent to one hundred percent of gait cycle and the late swing phase to terminal swing phase was estimated using synchronized motion data.

