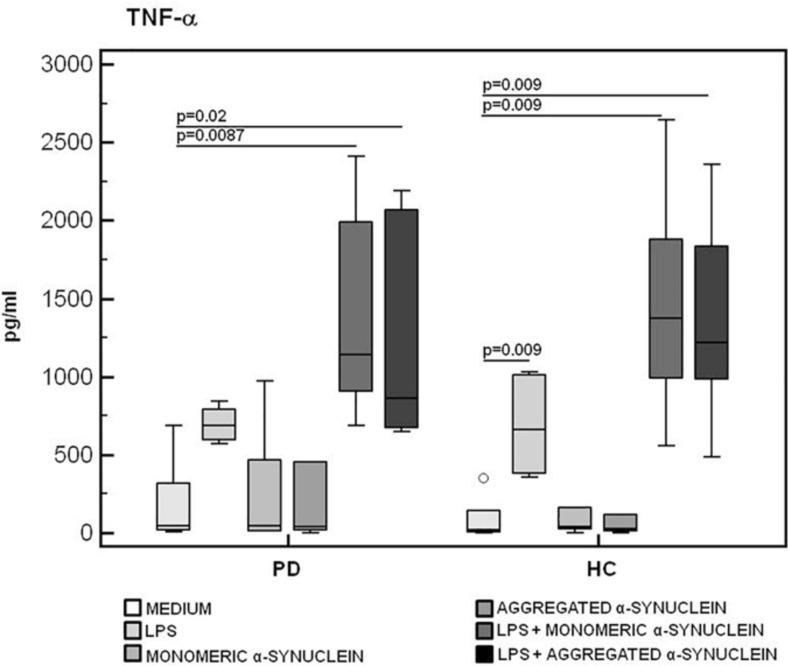
FIGURE 6.
TNF-α proinflammatory cytokine production by monomeric or aggregated α-synuclein–stimulated cells of PD and HC subjects. TNF-α concentration was evaluated by enzyme-linked immunosorbent assay in supernatants of unstimulated, LPS-stimulated, monomeric α-synuclein–stimulated, aggregated α-synuclein–stimulated, LPS-primed and monomeric α-synuclein–stimulated, or LPS-primed and aggregated α-synuclein–stimulated cells of 15 Parkinson disease (PD) patients and 15 healthy controls (HC). Summary results are shown in the bar graphs. The boxes stretch from the 25th to the 75th percentile; the line across the boxes indicates the median values; the lines stretching from the boxes indicate extreme values.

