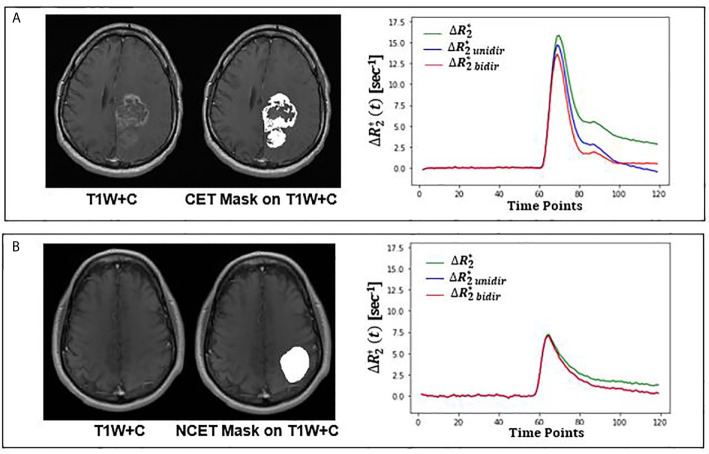
Figure 2.
Leakage correction effect on relaxivity-time curve for an enhancing (top) and nonenhancing (bottom) tumor from TCIA dataset. (A) Structural T1-weighted postcontrast (T1W+C) image overlaid with CET VOI on the left; mean uncorrected (green), bidirectional (red) and unidirectional (blue) corrected relaxivity-time in CET VOI on the right. (B) Structural T1-weighted postcontrast (T1W+C) image overlaid with NCET VOI on the left; mean uncorrected (green), bidirectional (red) and unidirectional (blue) corrected relaxivity-time in NCET VOI on the right. CET, Contrast Enhanced Tumor, NCET, Non Contrast Enhanced Tumor.

