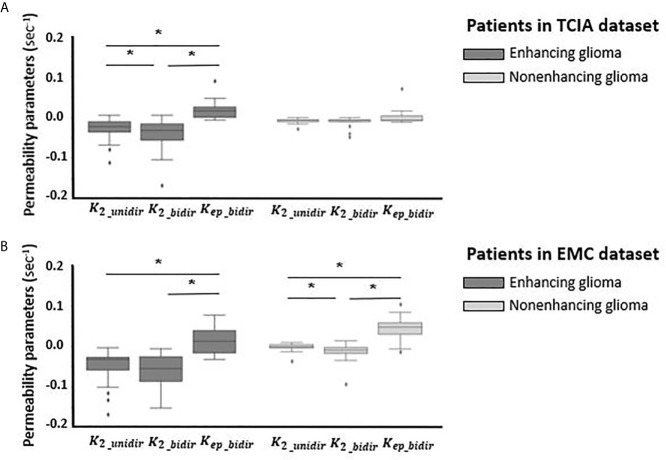
Figure 5.
Boxplots of permeability parameters of K2 in unidirectional correction method and K2 and Kep in bidirectional correction method from left to right (A) for enhancing glioma (n = 35) (dark gray) and for nonenhancing glioma (n = 14) (light gray) in TCIA dataset; (B) for enhancing glioma (n = 20) (dark gray) and nonenhancing glioma (n = 27) (light gray) in EMC dataset. *Significantly different, p < 0.05.

