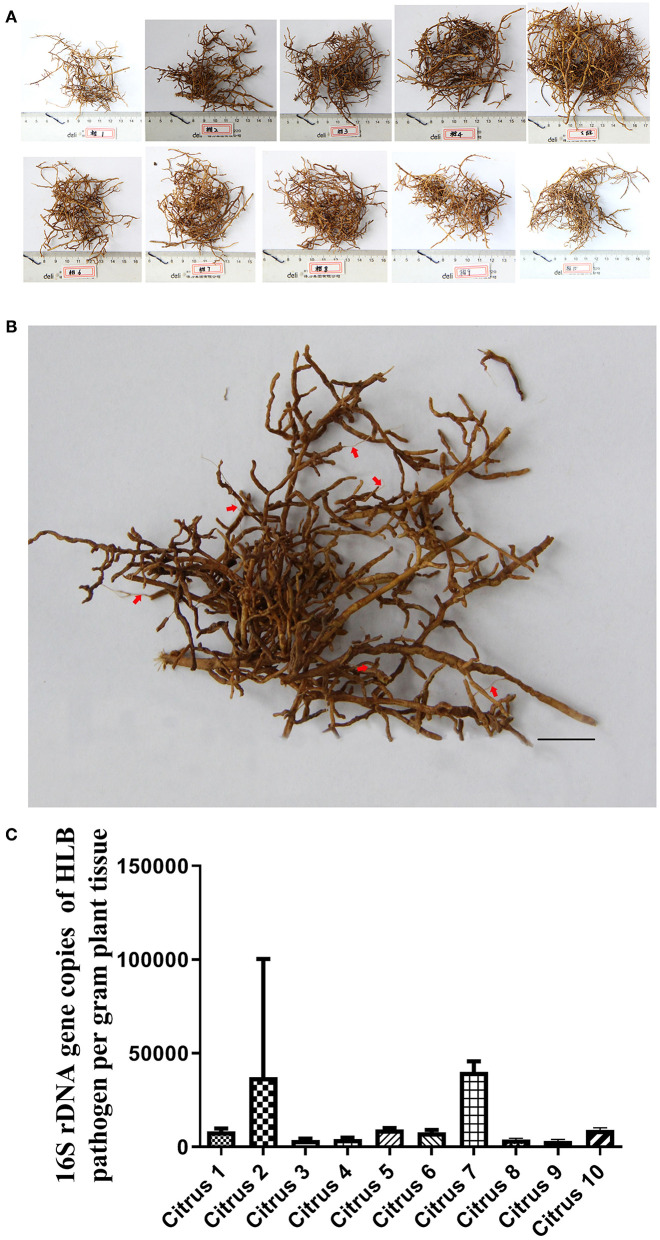
Figure 2.
Root lesion phenotype in citrus trees with slight HLB infection. (A) visual appearance of mildly HLB-infected tree roots. (B) detail of one root system presented in (A). Red arrows indicate lesions with tissue degradation and exposed xylem (Scale bars = 10 mm.) (C) HLB bacterial population in leaf midrib samples from plants corresponding to (A). And the standard curve used is 16S rDNA gene copies of Ca.Las per gram leaves midrib corresponding to (A), Y = −0.286X + 11.924, Y represents 16S rDNA gene copies of HLB pathogen, X represents Ct value. These data consistent with Supplementary Table 2.

