Figure 4.
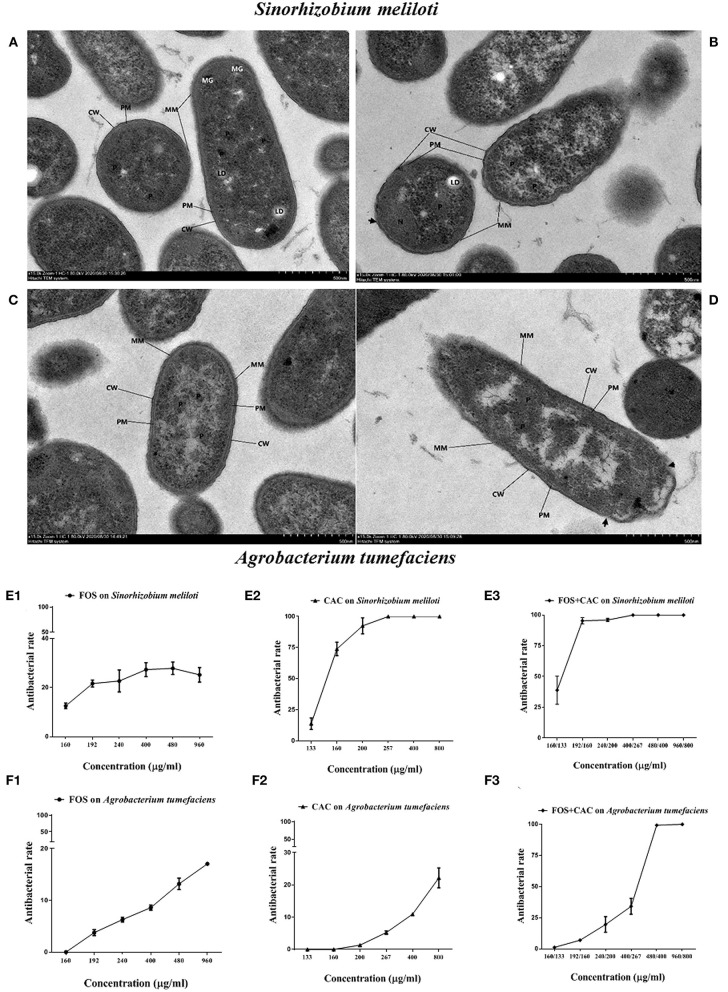
TEM images and antibacterial rate on two substitute bacteria of Ca.Las with FOS or/and CAC. (A) Control image of Sinorhizobium meliloti. (B) TEM image of Sinorhizobium meliloti with FOS + CAC (400/267 μg/mL) treatment. (C) Control image of Agrobacterium tumefaciens; the cell membrane (PM) is intact, no obvious plasmolysis and membrane breakage and dissolution are seen, and the periplasmic interval is normal. (D) TEM image of Agrobacterium tumefaciens with FOS + CAC (160/133 μg/mL) treatment; the protein mucosal layer (MM) is thin, and the local small area disappears, the cell wall (CW) showed irregular changes, partially broken or damaged (arrow). (E) Antibacterial rate of Agrobacterium tumefaciens. E1: FOS treatment alone; E2: CAC treatment alone; E3: FOS and CAC treatment. (F) Antibacterial rate of Sinorhizobium meliloti. F1: FOS treatment alone; F2: CAC treatment alone; F3: FOS and CAC treatment. Each group is divided into six concentration gradients, each gradient is repeated three times.

