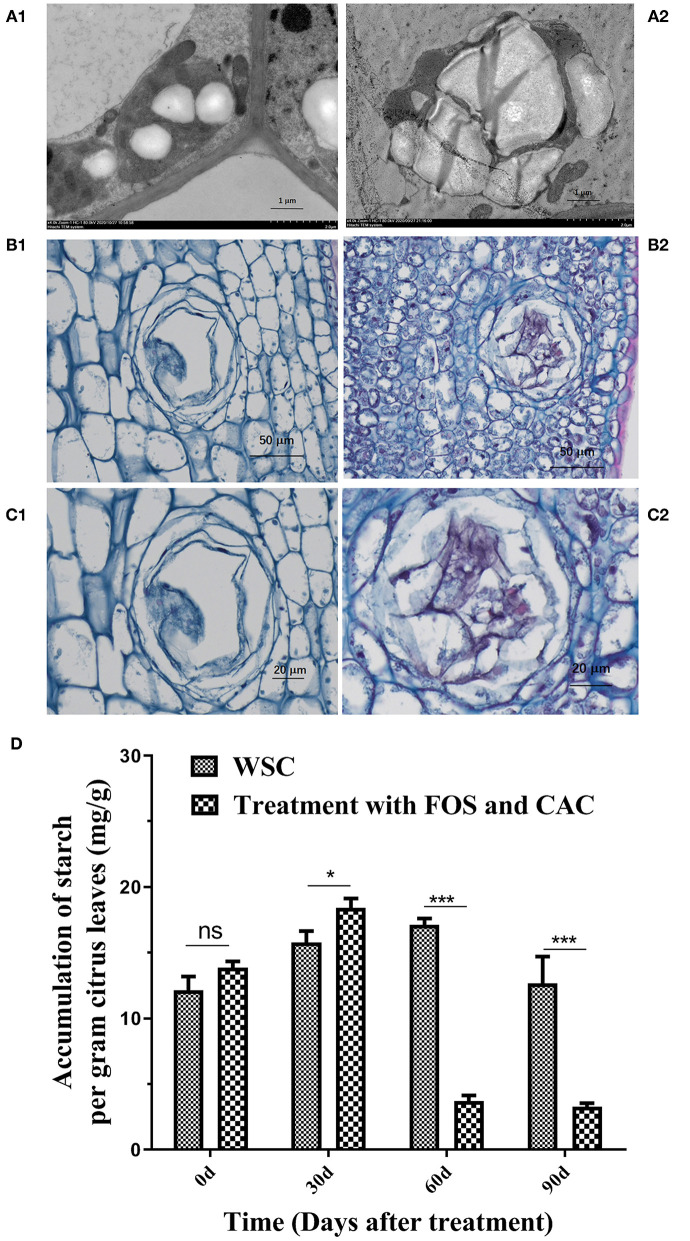
Figure 6.
Starch accumulation on HLB-infected citrus leave and was reduced after FOS and CAC treatment. (A) TEM images of citrus leaves. A1: healthy leaves; A2: HLB-infected leaves. (B) PAS and phenol yellows dyeing of citrus leaves. B1: healthy leaves; B2: HLB-infected leaves. (C) The secretory tissues of citrus leaves in partial enlargement of (B). C1: healthy leaves; C2: HLB-infected leaves. (D) The changes of starch accumulation during FOS + CAC combination treatment 90 days. Asterisk indicates significant differences during FOS + CAC combination treatment 90 days (Student's t-test, *p < 0.05, ***p < 0.001), ns indicated no significant differences.

