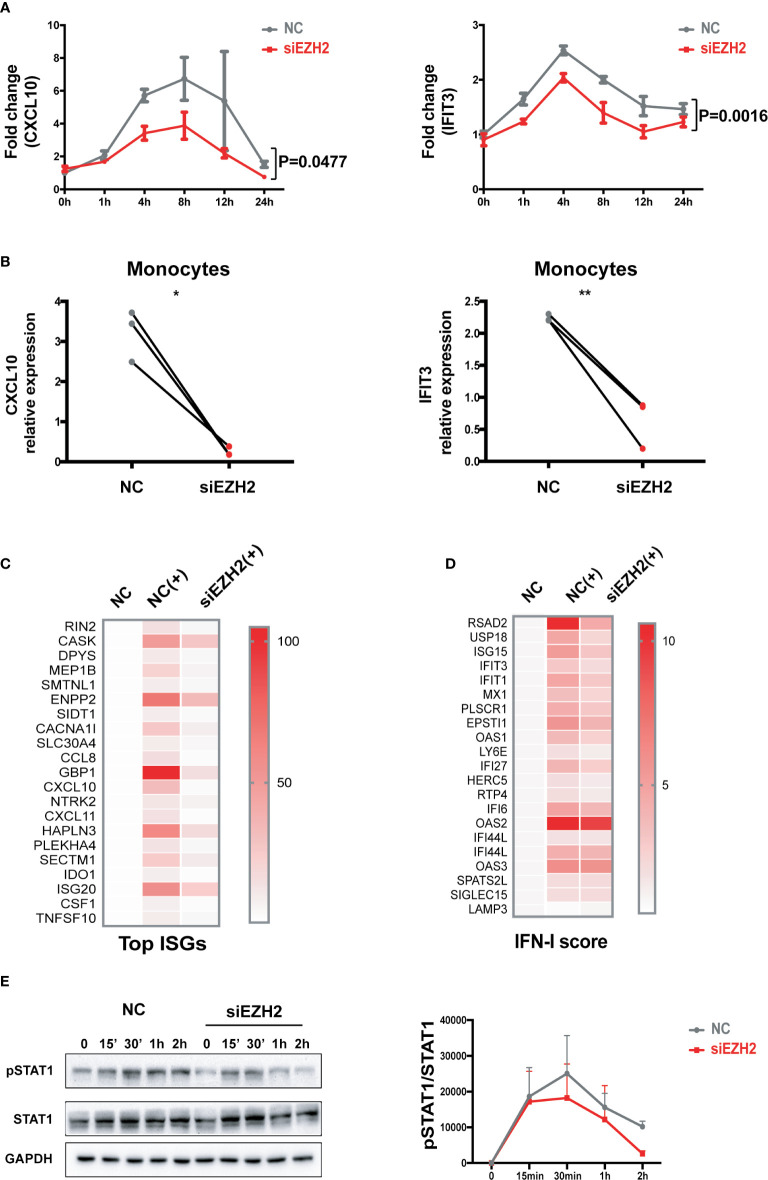
Figure 2.
EZH2 regulates the activation of IFN-I signaling pathway. (A) THP-1 cells were transfected with 200 nM of EZH2 targeting siRNAs (siEZH2) or negative control siRNAs (NC). Twenty-four hours after transfection, THP-1 cells were stimulated with 1,000 U/ml of universal type I IFN. (A) The levels of CXCL10 mRNA and IFIT3 mRNA were measured at the indicate time points. (B) Primary monocytes were electroporated with 200 nM of EZH2 targeting siRNAs (siEZH2) or negative control siRNAs (NC). Twenty-four hours after electroporation, the cells were stimulated with 1,000 U/ml of universal type I IFN for 6 h. (B) The levels of CXCL10 mRNA and IFIT3 mRNA were measured. (C, D) RNA-seq analysis of the THP-1 cells stimulated with 1,000 U/ml of universal type I IFN with the perturbation of EZH2 or not. (C) Top 20 most affected ISGs. (D) The 21 ISGs constitute IFN signature scoring panel (33, 34). (E) IFN-I induced phosphorylation of STAT1 was determined in THP-1 cells transfected with 200 nM of siEZH2 or NC by Western bolt. Representative pictures of at least three independent experiments are shown. Band densities quantified by Image J (A) data are presented as mean ± SEM from at least three independent experiments. P values were determined by two-way ANOVA. (B) Each pair of dots represents an individual donor (n = 3). P values were determined by Student’s paired t-test. *P < 0.05, **P < 0.01. (C, D) Each row represents individual genes. Each column is an individual treatment, NC: negative control siRNAs without IFN-I stimulation; NC (+): negative control siRNAs with IFN-I stimulation; siEZH2 (+): EZH2 targeting siRNAs with IFN-I stimulation.

