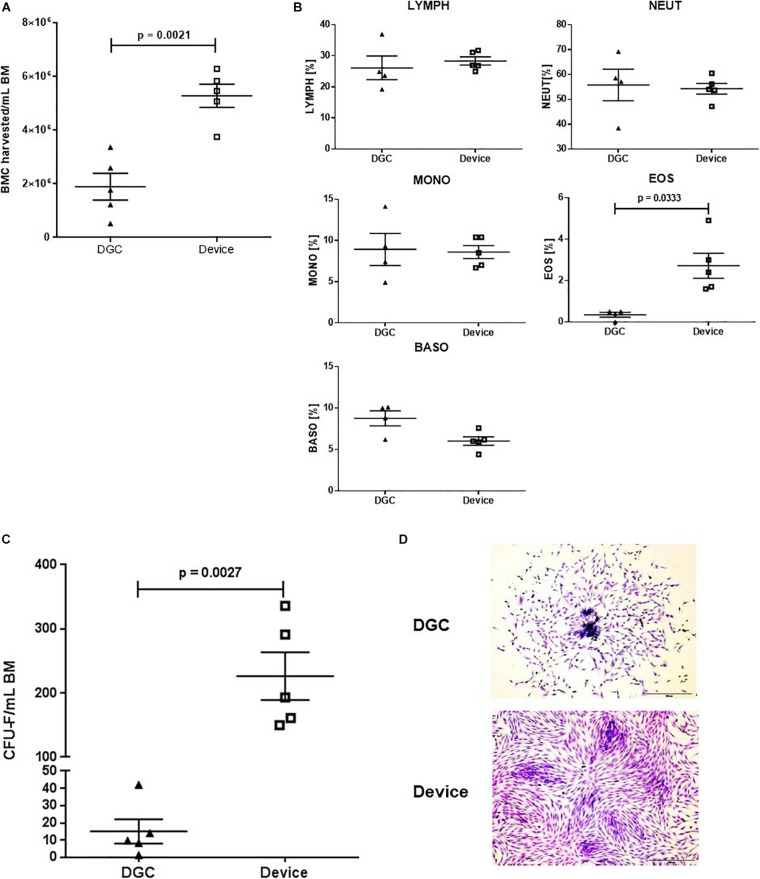
FIGURE 2.
CFU-F content and growth. BMC harvested per mL BM processed with the device and by DGC (A) and white blood cell subsets of the cell suspensions (B). Each data point represents one donor (n = 5 donors). Error bars: SEM. Paired t-test. CFU-F content per mL BM in MSCs isolated with the device and isolated by DGC at P0 (C). Each data point represents one donor (n = 5 donors) as mean of two technical replicates. Error bars: SEM. Paired t-test. Representative microphotographs show CFU-F from both groups (D). Crystal violet staining. Original magnification × 4; scale bar: 100 μm.

