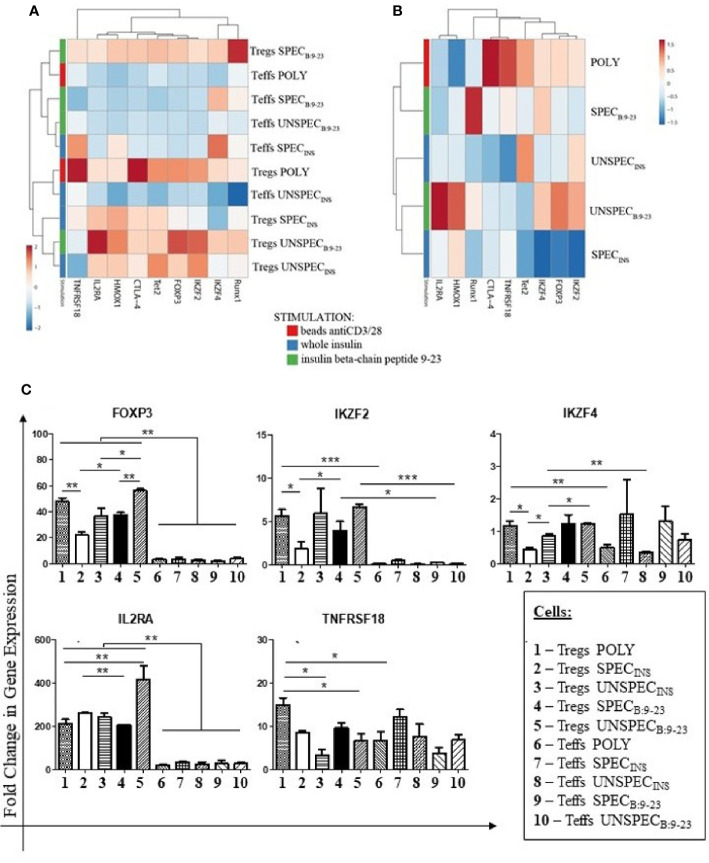
Figure 3.
Fold Change in Gene Expression in Tregs and Teffs. (A): Clustering and heat maps analysis of gene expression in Tregs: POLY, SPEC, UNSPEC and Teffs: POLY, SPEC, UNSPEC. (B) Clustering and heat maps analysis of gene expression only in Tregs. (C) Graphs presenting changes in cells populations. Only the expressions in which statistical significance occurred are presented. The cells were stimulated with beads anti-CD3/anti-CD28 (index POLY) or monocytes loaded with whole insulin (index INS) or insulin β chain peptide 9-23 (index B:9-23). The cells responding to antigen have an index SPEC, cells not recognizing the antigen have an index UNSPEC. All stimulations were performed in triplicates (three tests for whole insulin and three tests for insulin β chain peptide 9-23). The results are presented as mean+/- SD. Significance was calculated using the t- test, significant results are marked with * (p<0.05), ** (p<0.01) or *** (p<0.001). Heat maps were prepared using ClustVis tool based on correlation distance and average linkage between clusters (21).

