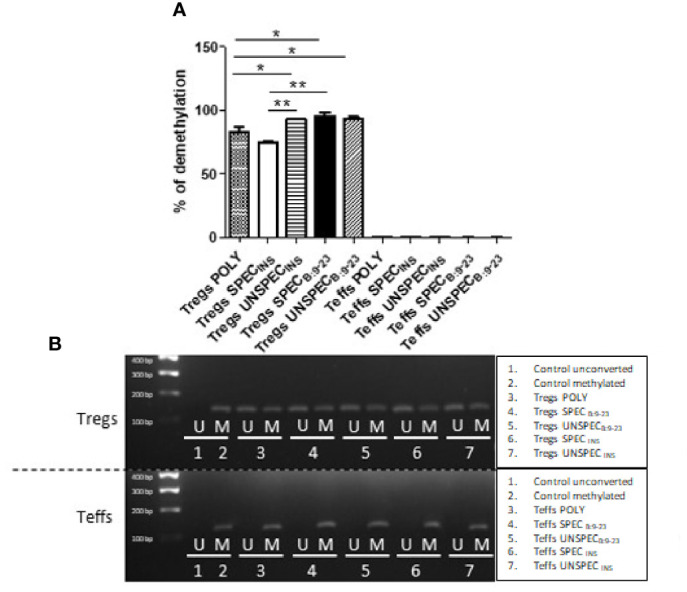
Figure 5.

FoxP3 demethylation in TSDR region in Tregs and Teffs. (A) Comparison of percentage of demethylation in Treg-specific demethylated region (TSDR) in Tregs: POLY, SPEC, UNSPEC and Teffs: POLY, SPEC, UNSPEC. (B) Representative results showing FoxP3 demethylation in all cell cultures was detected by agarose gel electrophoresis [reaction with methylated (M) and unmethylated (U) primer]. During the tests cells were stimulated with anti-CD3/anti-CD28 beads (index POLY) or monocytes loaded with whole insulin (index INS) or insulin β chain peptide 9-23 (index B:9-23). Cells responding to the antigen have an index SPEC, cells not recognizing presented antigen have an index UNSPEC. All analyzes were performed for six tests (three tests for whole insulin and three tests for insulin β chain peptide 9-23) in triplicate. The results are presented as mean+/- SD. Significance was calculated using the t- test, significant results are marked with *(p<0.05), **(p<0.01) or ***(p<0.001).
