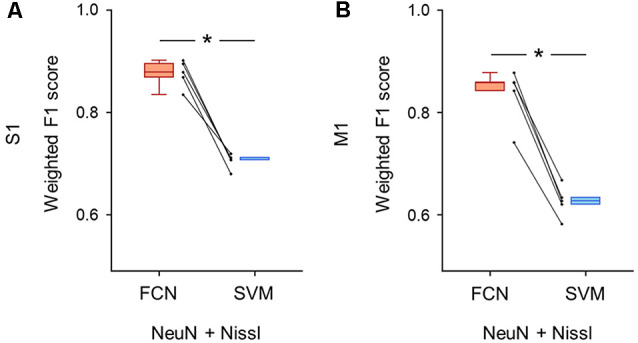
Figure 6.

Classification performance of cell images using both anti-NeuN and Nissl fluorescence signals. (A) Weighted F1 score of the FCN model (red) and the PCA-SVM classifier (blue) trained on cell images from S1. Two fluorescent signals (i.e., anti-NeuN and Nissl) were used for training. Each point (gray) signifies the score for the cross-validation (5-fold). P = 3.0 × 10⁻⁴, t(4) = 11.7, n = 5-fold cross-validations, paired t-test. *P < 0.05. (B) The same as (A), but for M1. P = 1.9 × 10⁻⁴, t(4) = 13.2, n = 5-fold cross-validations, paired t-test. *P < 0.05. Abbreviations: S1, primary somatosensory cortex; M1, primary motor cortex; FCN, fully convolutional network; SVM, support vector machine; PCA, principal component analysis.
