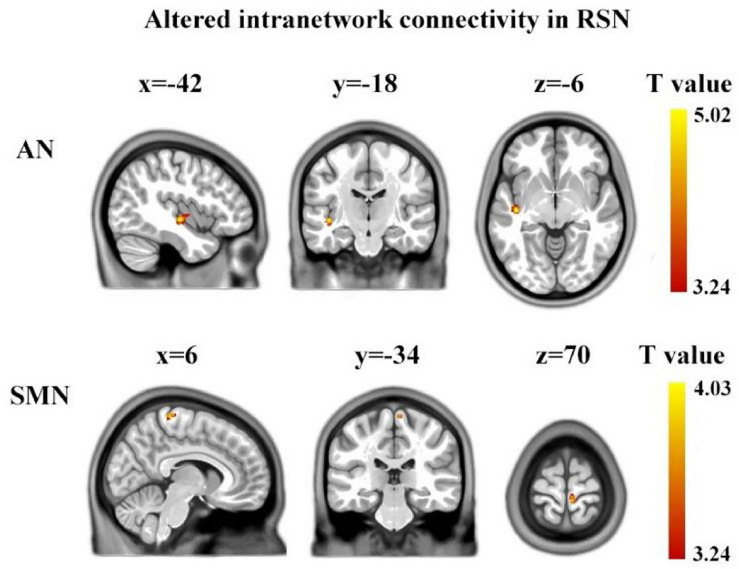
FIGURE 2.
Brain regions showing between-group significant differences in intranetwork functional connectivity. The yellow color denotes the region with significantly increased connectivity in the ASD group, located in AN and SMN, respectively. The color bar represents the T-value (voxel level p < 0.001, cluster level p < 0.05, AlphaSim corrected). AN, auditory network; SMN, sensorimotor network.

