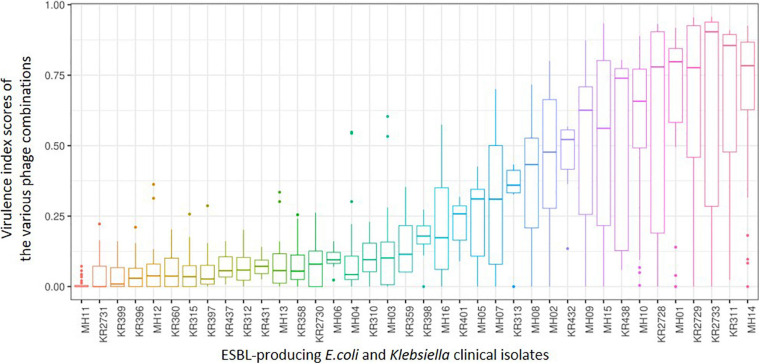
FIGURE 5.
A box and whisker plot depicting the range of killing assay virulence index scores from all phage combinations explored during this work for each of the 38 ESBL-producing clinical isolates. From left to right shows the ESBL-producing clinical isolates that are most resistant to the combinations attempted to those that are most sensitive. Please note not all combinations were completed in triplicate for those combinations that were not part of the final ESBL cocktail (all six phages).

