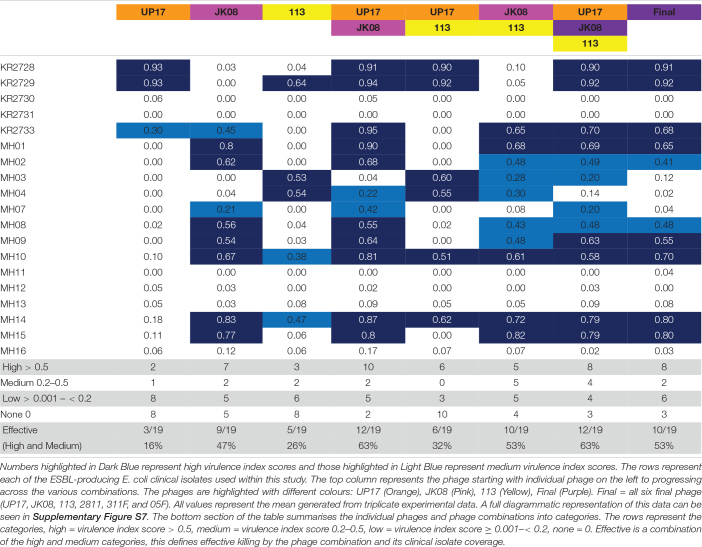
TABLE 1.
The virulence index scores of individual phage and various phage combinations across all the 19 ESBL-producing E. coli clinical isolates.
 |
Numbers highlighted in Dark Blue represent high virulence index scores and those highlighted in Light Blue represent medium virulence index scores. The rows represent each of the ESBL-producing E. coli clinical isolates used within this study. The top column represents the phage starting with individual phage on the left to progressing across the various combinations. The phages are highlighted with different colours: UP17 (Orange), JK08 (Pink), 113 (Yellow), Final (Purple). Final = all six final phage (UP17, JK08, 113, 2811, 311F, and 05F). All values represent the mean generated from triplicate experimental data. A full diagrammatic representation of this data can be seen in Supplementary Figure S7. The bottom section of the table summarises the individual phages and phage combinations into categories. The rows represent the categories, high = virulence index score > 0.5, medium = virulence index score 0.2–0.5, low = virulence index score ≥ 0.001–< 0.2, none = 0. Effective is a combination of the high and medium categories, this defines effective killing by the phage combination and its clinical isolate coverage.
