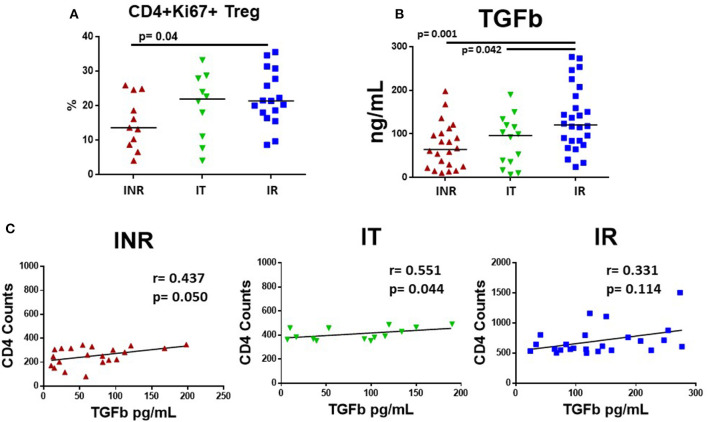
Figure 5.
Plasma levels of TGF-β and proportions of cycling memory CD4+ cells that are T regulatory cells in HIV+, treated participants. PBMCs were stained for Tregs using Miltenyi Biotec's Treg Detection kit and plasma was measured for TGF-β using R&D System ELISA kit. Each symbol represents one subject, red triangles = INR, CD4 <350/uL, <50 years old; green inverted triangles = IT CD4 350–500/uL, <50 years old; blue squares = IR CD4 >500/uL, <50 years old. (A) Proportions of CD3+CD4+CD45RA-Ki67+ cells that were CD127-CD25+ and FoxP3+, identified as Tregs are shown. (B) TGF-β was activated with 1N HCL and measured following manufacture's protocol; plasma levels are shown. Comparisons between 2 groups were made using a Mann-Whitney U-test. (C) Plasma levels of TGF-β were compared to CD4 T cell counts in treated, HIV-infected INR, IT, and IR participants using a rank order Spearman's analysis. Significance thresholds were set at p-values equal to or <0.05.

