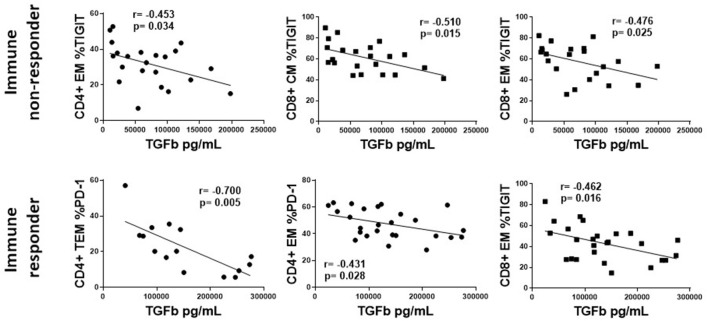
Figure 6.
The association of plasma levels of TGF-β with T cell markers of exhaustion and senescence in treated, HIV-infected immune non-responders and responders. Representative correlations from Supplemental Table 1 are show. Top row, immune non-responders (INR); Plasma levels of TGF-β (x-axis) vs. CD4+ EM proportion of TIGIT, or CD8+ CM and EM proportions of TIGIT (y-axis). Bottom row, immune responders (IR); Plasma levels of TGF-β (x-axis) vs. CD4+ EM and TEM proportion of PD-1, or CD8+ EM proportions of TIGIT. Correlations were calculated using a Spearman's rank order analysis; p = <0.05 considered statistically significant.

