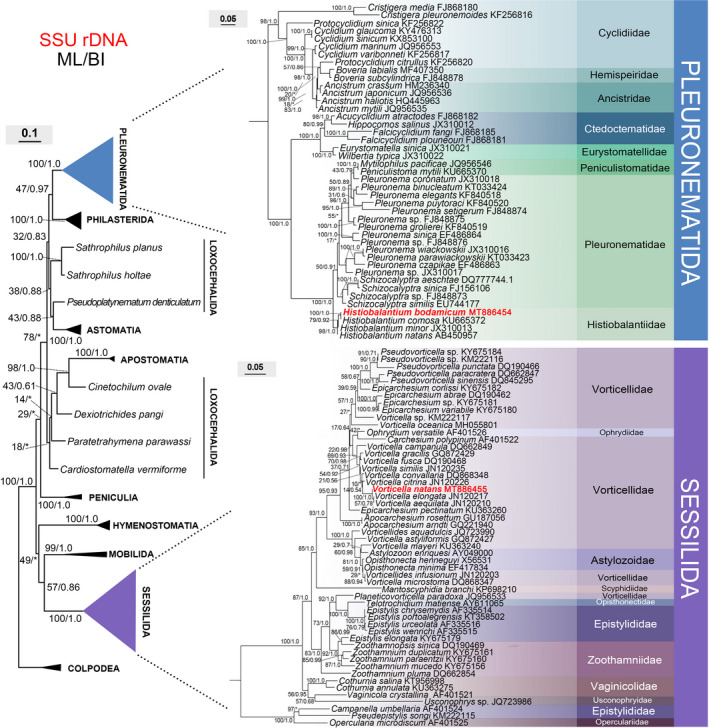
Figure 6.

Maximum‐likelihood (ML) tree inferred from SSU rDNA sequences showing the systematic position of Histiobalantium bodamicum and Vorticella natans (bold). Numbers near nodes are nonparametric bootstrap values for ML and posterior probability values for Bayesian inference (BI). "*" refers to disagreement in topology with the BI tree. All branches are drawn to scale. The names of the species are updated, that is, do not always agree with those in GenBank. The scale bar corresponds to 10 and 5 substitutions per 100 nucleotide positions in the left tree and two right trees, respectively.
