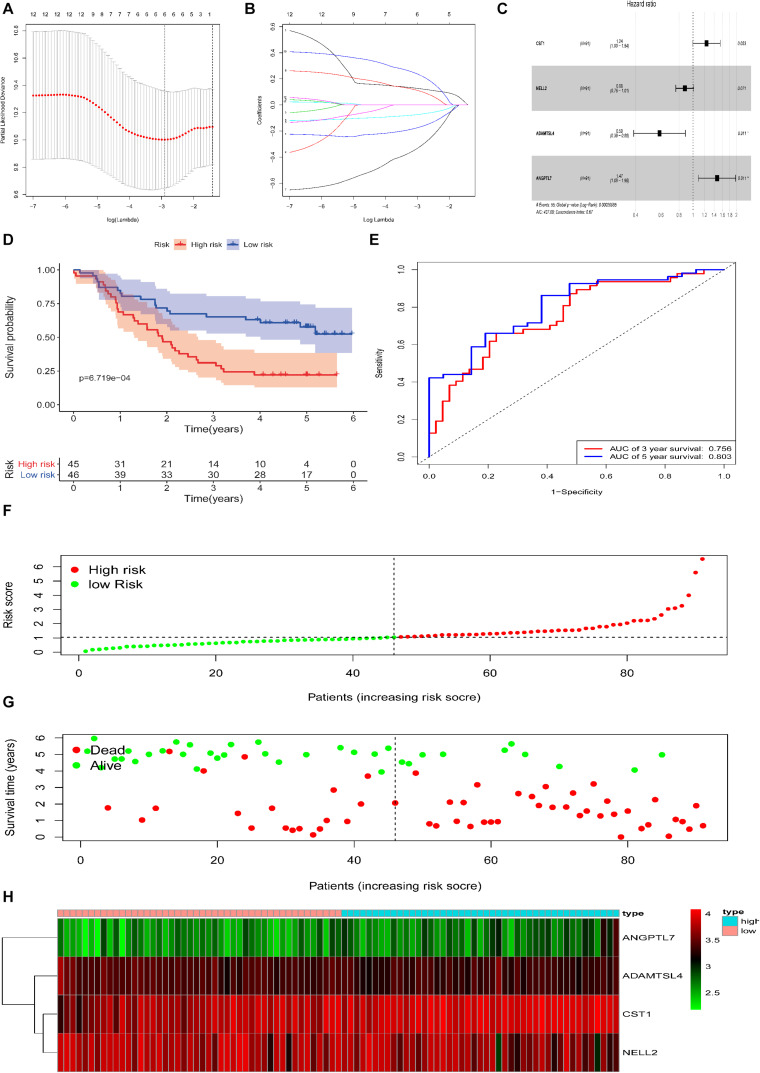
FIGURE 3.
Construction of the DEG-based prognostic signature in the training cohort of patients with ESCC. (A,B) Lasso analysis yielded six genes for further analysis. (C) Multivariate regression analysis identified four genes to be included in the ECM-related prediction model. (D) Kaplan-Meier survival curves of the relative overall survival of the high- and low-risk groups. (E) ROC curve analysis of the prognostic signature. (F) Distribution of the four gene-based risk scores. (G) Vital statuses of patients in the high- and low-risk groups. (H) Heatmap of four-gene expression profiles in the high- and low-risk groups.

