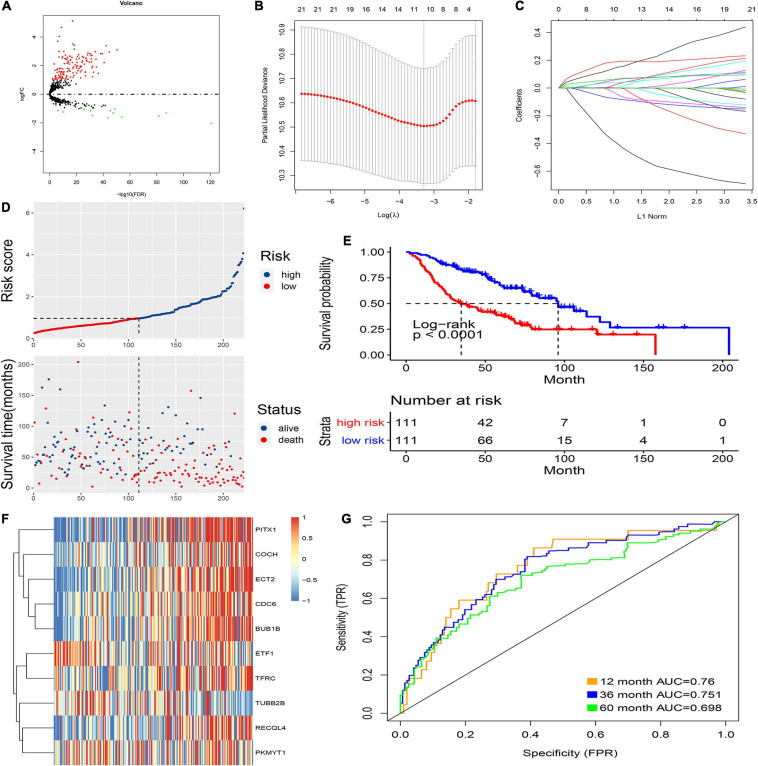
FIGURE 2.
Prognostic model of the training cohort and risk signature with the 10 CCRGs. (A) LUAC-specific CCRGs were screened out. (B) The association between deviance and log(λ). (C) The association between coefficients of genes and log(λ). (D) Risk score of the high and low groups. (E) Survival analysis of the high and low groups. (F) Heatmap of the expression of 10 CCRGs. (G) The AUC of the ROC.

