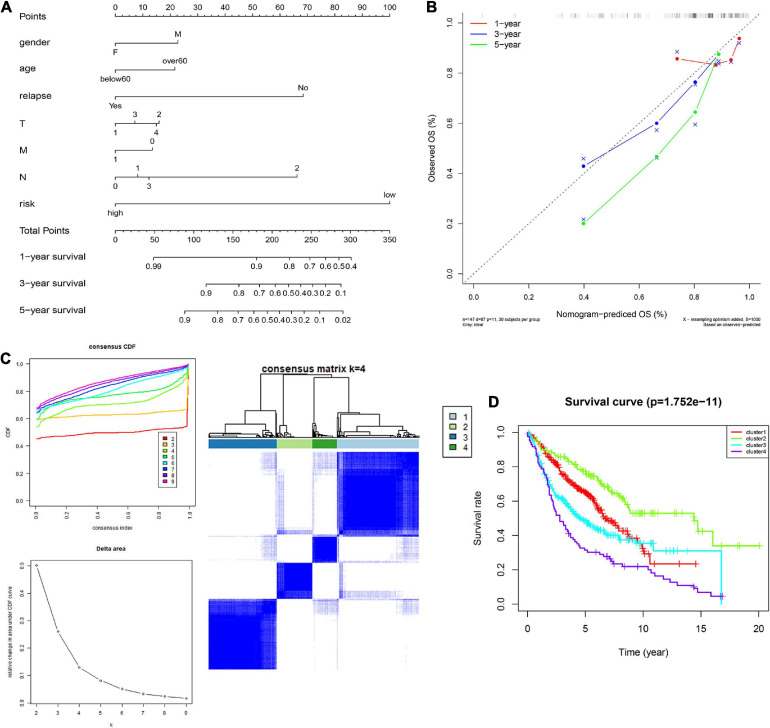
FIGURE 6.
Construction and validation of the nomogram. (A) Details of the nomogram, (B) Calibration analysis based on the nomogram. (C) Molecular subgrouping based on 10 CCRGs: Elbow and gap plot for different numbers of subgroups; Consensus heatmap of the clusters. (D) Survival analysis of the four subgroups.

