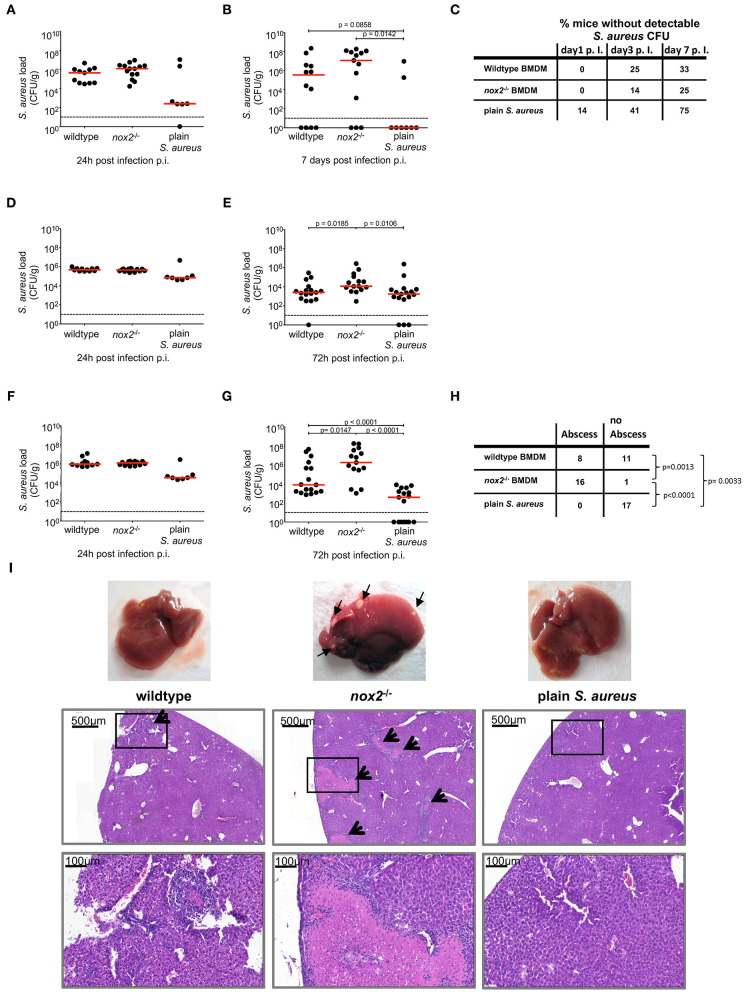
Figure 3.
Bacterial load in kidney, spleen and liver from mice upon injection of BMDM infected with S. aureus. BMDM of wildtype or nox2−/− mice were infected with S. aureus MW2 GFP (MOI30) on day 8 post isolation from bone marrow. Upon infection 2.5 × 10⁶ BMDM were injected in PBS intravenously into naive C57Bl6J mice. Mice injected with 4 × 10⁶ plain S. aureus MW2 GFP, corresponding to the CFU recovered from infected BMDM served a control. Represented are individual values for each organ in CFU/g from two independent experiments. Red line indicates median, dashed line represents limit of detection. Student's t-test was performed on log-transformed values. CFU numbers were analyzed. in kidneys (A) 24 h (wt: n=11; nox2−/−: n=14; plain S. aureus: n=7) and (B) 7 days (wildtype: n=12; nox2−/−: n=13; plain S. aureus: n=8). (C) Percentage of mice without detectable CFU in kidneys for indicated timepoints. CFU numbers in spleen (D) 24 h and (E) 72 h (wildtype: n=17; nox2−/−: n=15; plain S. aureus: n=17) p.i. CFU numbers in liver (F) 24 h and (G) 72 h p.i. (H) Contingency table for presence or absence of visible abscesses in liver 72 h post infection analyzed by Fisher‘s exact test. (I) Representative pictures from livers 72 h post infection with micrographs from respective Hematoxylin-Eosin staining on formalin fixed tissue. Black arrows indicate abscesses. Scale bar represents 500 μm in upper and 100 μm in lower micrographs, respectively. Rectangular zone in upper pictures indicates position of bottom pictures. NOX, NADPH Oxidas; ROS, reactive oxygen species; PMA, phorbol 12-myristate 13-acetate; DPI, diphenyleniodonium; MOI, multiplicity of infection; BMDMs, bone marrow derived macrophages; SD, standard deviation; TLR2, Toll-like receptor 2; NMS, normal mouse serum; p.i., post infection; CFU, colony forming unit; i.v., intravenous; s.c., subcutaneous.

