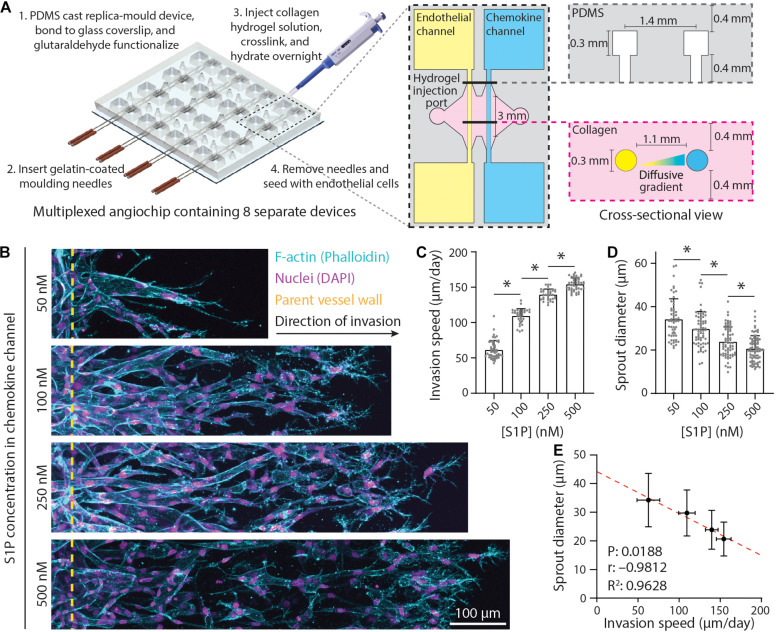
FIGURE 1.
Endothelial sprout invasion speed is anti-correlated with sprout diameter. (A) Schematic overview of multiplexed angiogenesis-on-a-chip platform. Polydimethylsiloxane (PDMS) replica casts are generated from 3D printed molds and are composed of a 2 × 4 array of single devices. These PDMS molds are bonded to glass coverslips and functionalized with glutaraldehyde (Step 1). Gelatin-coated needles are then inserted into the device (Step 2). Type 1 collagen hydrogel precursor solution is injected into each device, allowed to cross-link around the needles, and hydrated overnight (Step 3). Needle removal generates 3D channels fully embedded within user-defined hydrogel (Step 4). Each device is composed of two parallel channels: (1) an endothelial channel seeded with endothelial cells (ECs) to serve as the parent vessel from which angiogenic sprouting is induced and (2) a chemokine channel to which pro-angiogenic factors [e.g., sphingosine 1-phosphate (S1P)] are added to generate diffusive gradients that promote EC activation and invasion across a user-defined 3D extracellular matrix (e.g., collagen hydrogel). (B) Representative images (max intensity projections) of invading ECs in response to varying S1P. All conditions were cultured for 5 days with indicated S1P dose in endothelial cell growth medium 2 [EGM2; supplemented with 25 ng ml–1 phorbol 12-myristate 13-acetate (PMA)] added to the chemokine channel within 3 mg ml–1 collagen hydrogels. F-actin (cyan), nuclei (magenta), and yellow dashed lines indicate parent vessel edge. (C,D) Quantifications of invasion speed and sprout diameter as a function of S1P. For invasion speed: n ≥ 36 per condition and for sprout diameter: n ≥ 55 per condition. (E) Relationship between invasion speed and sprout diameter, with red dashed line indicating a linear regression and statistical analysis performed by Pearson’s correlation. Sample size for each mean was taken from panels (C,D). All data presented as mean ± SD; ∗indicates a statistically significant comparison with P < 0.05 (one-way analysis of variance).

