FIGURE 5.
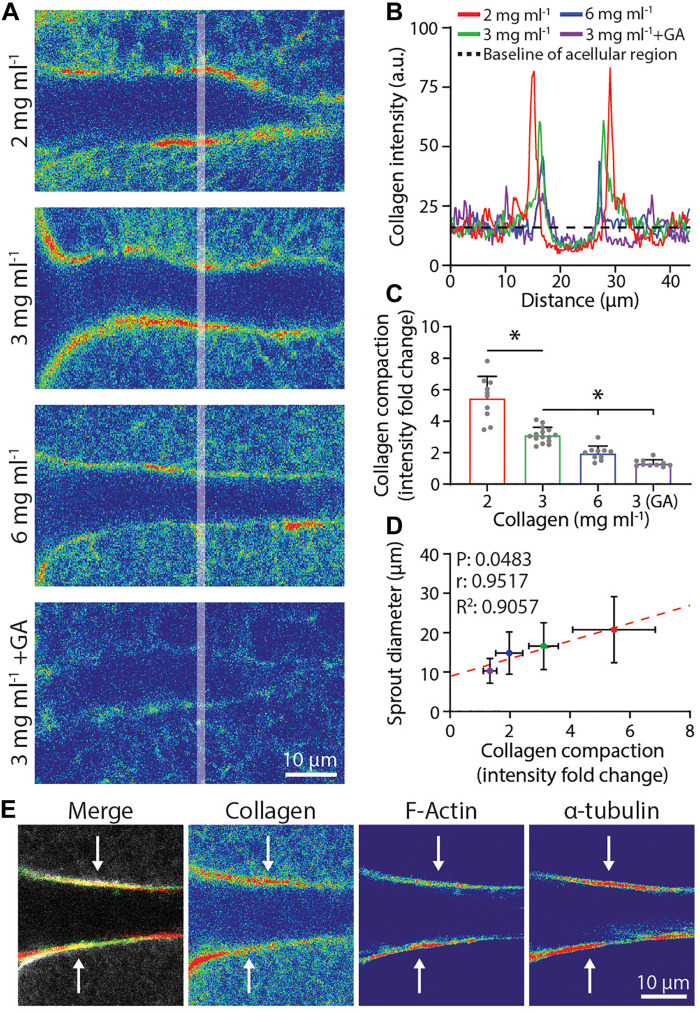
Degree of collagen compaction adjacent to sprout stalk cells positively correlates with sprout diameter. (A) Representative images (individual z-slices) of fluorescently labeled collagen (shown as intensity heat map) surrounding sprout stalk cells in collagen matrices of varying density and stiffness. Sprouts were cultured for 3 days in 250 nM sphingosine 1-phosphate (S1P) and 50 ng ml–1 phorbol 12-myristate 13-acetate (PMA) within collagen matrices of indicated density or with glutaraldehyde (GA) cross-linking. (B) Representative fluorescent collagen intensity profiles acquired along shaded white line indicated in panel (A). 2 mg ml–1 (red line), 3 mg ml–1 (green line), 6 mg ml–1 (blue line), and 3 mg ml–1 with GA cross-linking (purple line) and average intensity of non-compacted, acellular areas (dashed black line). Intensity values of the non-compacted, acellular collagen regions were normalized to each other in panels (A,B) to compare collagen intensity fold change of compacted regions. (C,D) Quantification of collagen compaction and relationship between collagen compaction and sprout diameter, with red dashed line indicating a linear regression and statistical analysis performed by Pearson’s correlation. For collagen compaction: n ≥ 10 per condition. For each mean in panel (D), n ≥ 10 for collagen compaction and n ≥ 70 for sprout diameter. (E) Representative images (individual z-slices) of sprout stalk region stained for F-actin (green) and α-tubulin (red) within fluorescently labeled collagen (gray). Individual channels visualized as intensity heat maps. All data presented as mean ± SD; *indicates a statistically significant comparison with P < 0.05 (one-way ANOVA).

