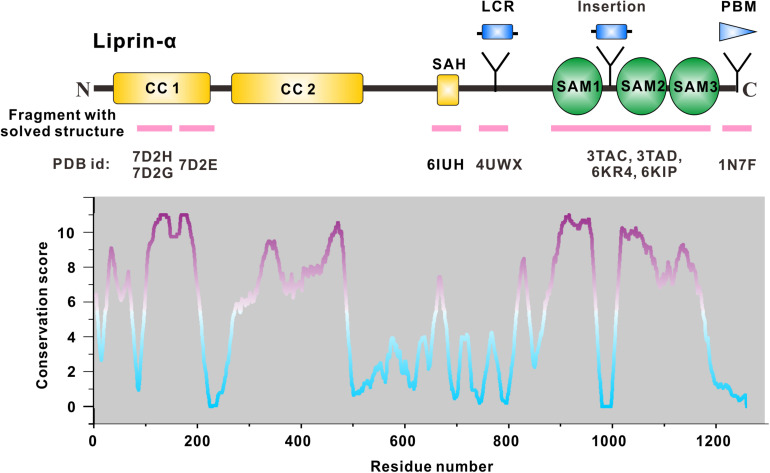
FIGURE 1.
Domain organization of liprin-α. The diagram depicts the domains or regions of liprin-α. CC, coiled-coil region; SAH, single alpha helix; SAM, sterile-α-motif domain. Isoform or species-specific regions were shown above the schematic diagram. LCR, a liprinα3 core region in liprin-α3; Insertion, an inserted loop region in liprin-α2/3/4; PBM, a PDZ binding motif in vertebrate liprin-αs. Regions of liprin-α with solved structure were highlighted by pink lines under the diagram. PDB ids were shown under the pink lines (7D2H and 7D2G for liprin-α2_H2, 7D2E for liprin-α2_H3; 6IUH for the liprin-α2_SAH/GIT1_PBD complex; 4UWX for the liprin-α3_LCR/mDia_DID complex; 3TAC, 3TAD, 6KR4, and 6KIP for the SAM123 structures in complex with CASK_CaMK, liprin-β1_SAM123, LAR_D1D2, and PTPδ_D2, respectively; 1N7F for the liprin-α1_PBM/GRIP1_PDZ6 complex). The value curve at the bottom panel indicates sequence conservation of liprin-α proteins. The conservation score for each residue was calculated in Jalview (Waterhouse et al., 2009) using the sequence alignment of liprin-α family members across species, including Caenorhabditis elegans, Drosophila melanogaster, Danio rerio, Xenopus tropicalis, Gallus gallus, Mus musculus, and Homo sapiens. The scores from 0 to 11 indicate the most variable to the most conserved state of each residue, colored from cyan to purple gradually.

