
Figure 3. Identification of Phage in SearchSRA (PhiSh) related to isolated B. thetaiotaomicron-infecting phages.
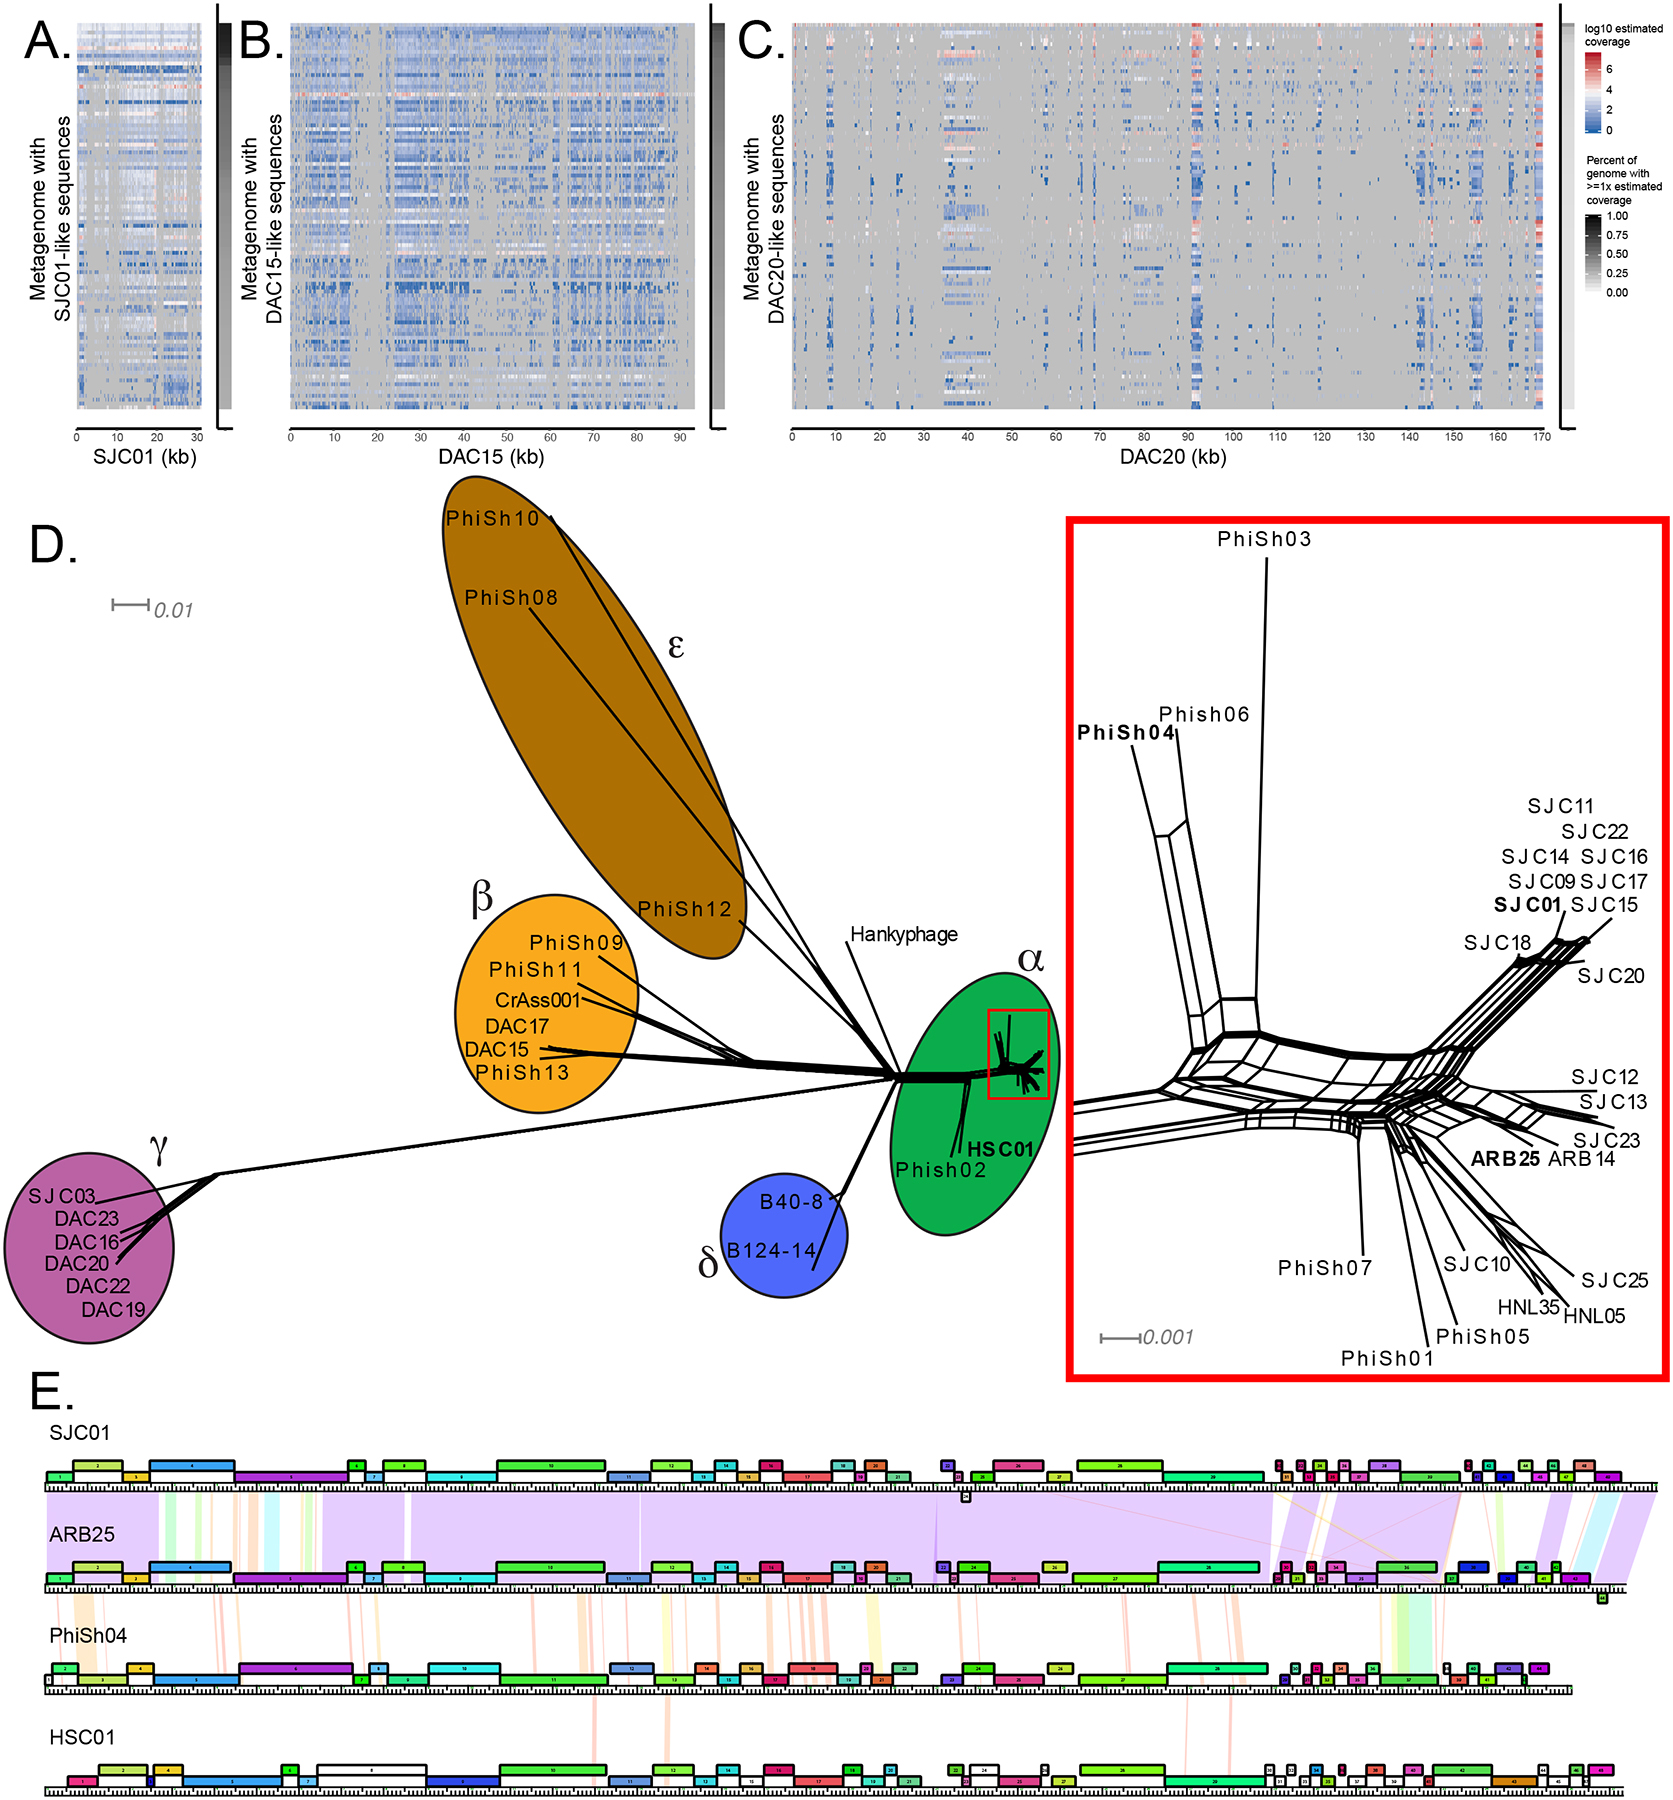
Representatives of each genome cluster (SJC01, DAC15, DAC20) were used to query the entire NCBI SRA using SearchSRA (see STAR Methods). (A-C) Log10-transformed coverage depth of the 100 best hits identified via SearchSRA (tDNA mode) to SJC01, DAC15, and DAC20, respectively. Hits are ranked along the y-axis based on percent coverage by reads. The x-axis represents genome positions of SJC01, DAC15, and DAC20, respectively. The percentage of SJC01, DAC15, and DAC20 genomes detected (≥ 1 read) in each metagenome is indicated by the gray shaded column on the right of each panel. (D) Network phylogeny of Bacteroides-infecting phage genomes described in Figure 2 and related genomes identified in publicly available metagenomes. Genomes were compared according to shared gene content using Phamerator and Splitstree (see STAR Methods). Colored ellipses indicate groups of phages according to cluster assignment, assigned by vConTACT2. The subset of cluster alpha phages enclosed in a rectangle is shown in greater detail at the right-hand side of the panel. Phages highlighted in panel E are in bold. The scale bars indicate 0.01 and 0.001 substitutions per site for the main tree and the cluster alpha subset, respectively. (E) Genome maps of 4 cluster α phages (SJC01, ARB25, PhiSh04, and HSC01). The genes are color-coded according to pham membership and are numbered. Pairwise nucleotide identity is represented as shading between genomes. The color of this shading represents the degree of sequence similarity with violet being the most similar (BLASTN score = 0), progressing through the color spectrum from indigo, blue, green, yellow, orange, to red, which is the least similar (BLASTN score = 10−4). Regions with no shading indicate no similarity with a BLASTN score greater than 10−4. See also Tables S6–S8.