
Fig. 2.
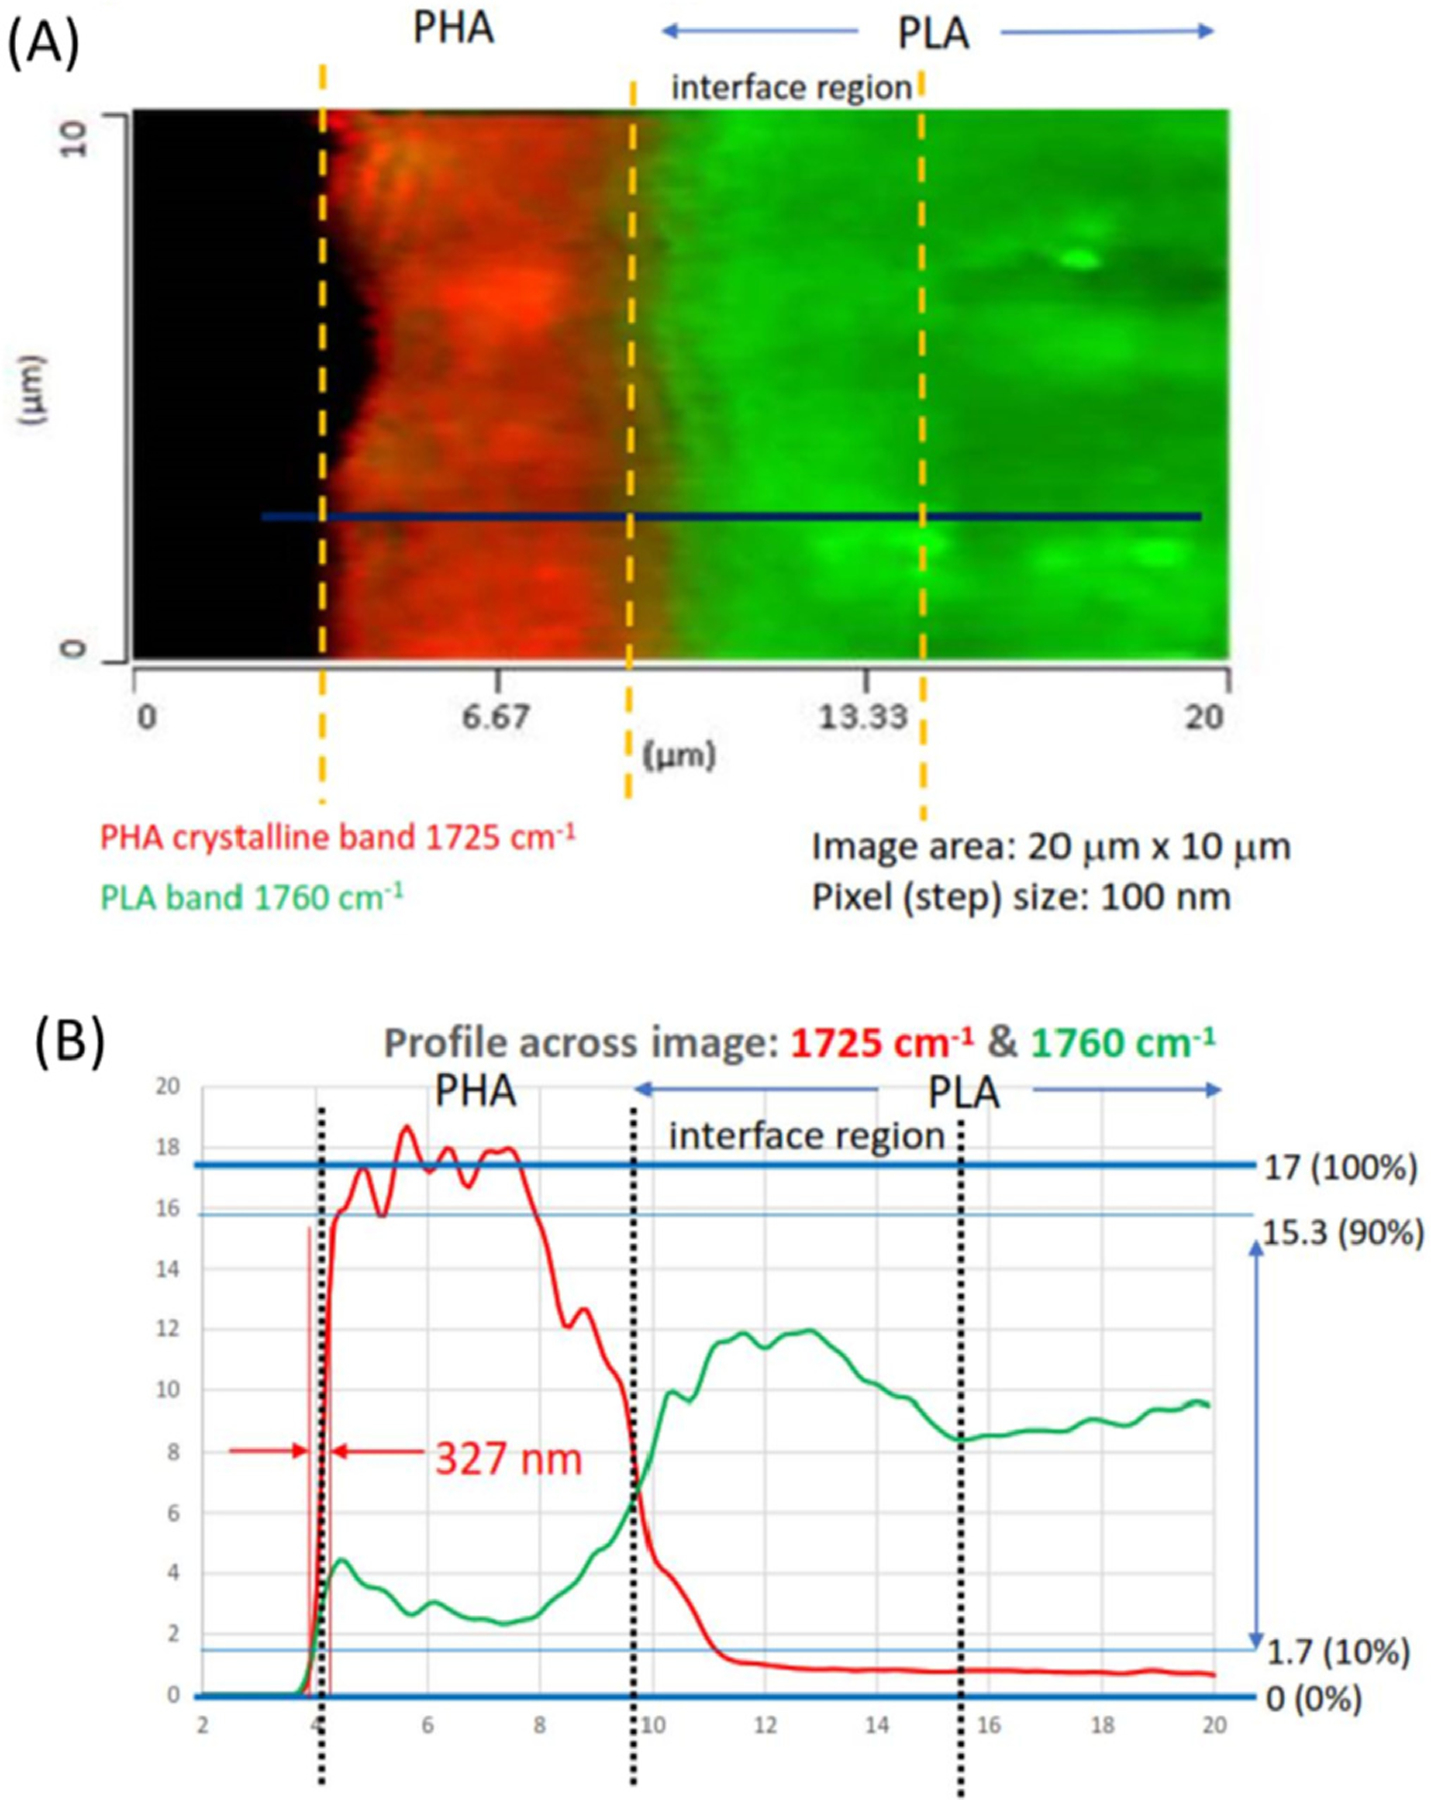
The fixed wavenumber image (A) and spectral intensity profiles (B) of the PHA/PLA laminate cross section represented by the O-PTIR carbonyl stretching bands at 1725 cm–1 for PHA and 1760 cm–1 for PLA.
Official websites use .gov
A
.gov website belongs to an official
government organization in the United States.
Secure .gov websites use HTTPS
A lock (
) or https:// means you've safely
connected to the .gov website. Share sensitive
information only on official, secure websites.
The fixed wavenumber image (A) and spectral intensity profiles (B) of the PHA/PLA laminate cross section represented by the O-PTIR carbonyl stretching bands at 1725 cm–1 for PHA and 1760 cm–1 for PLA.