Fig. 2.

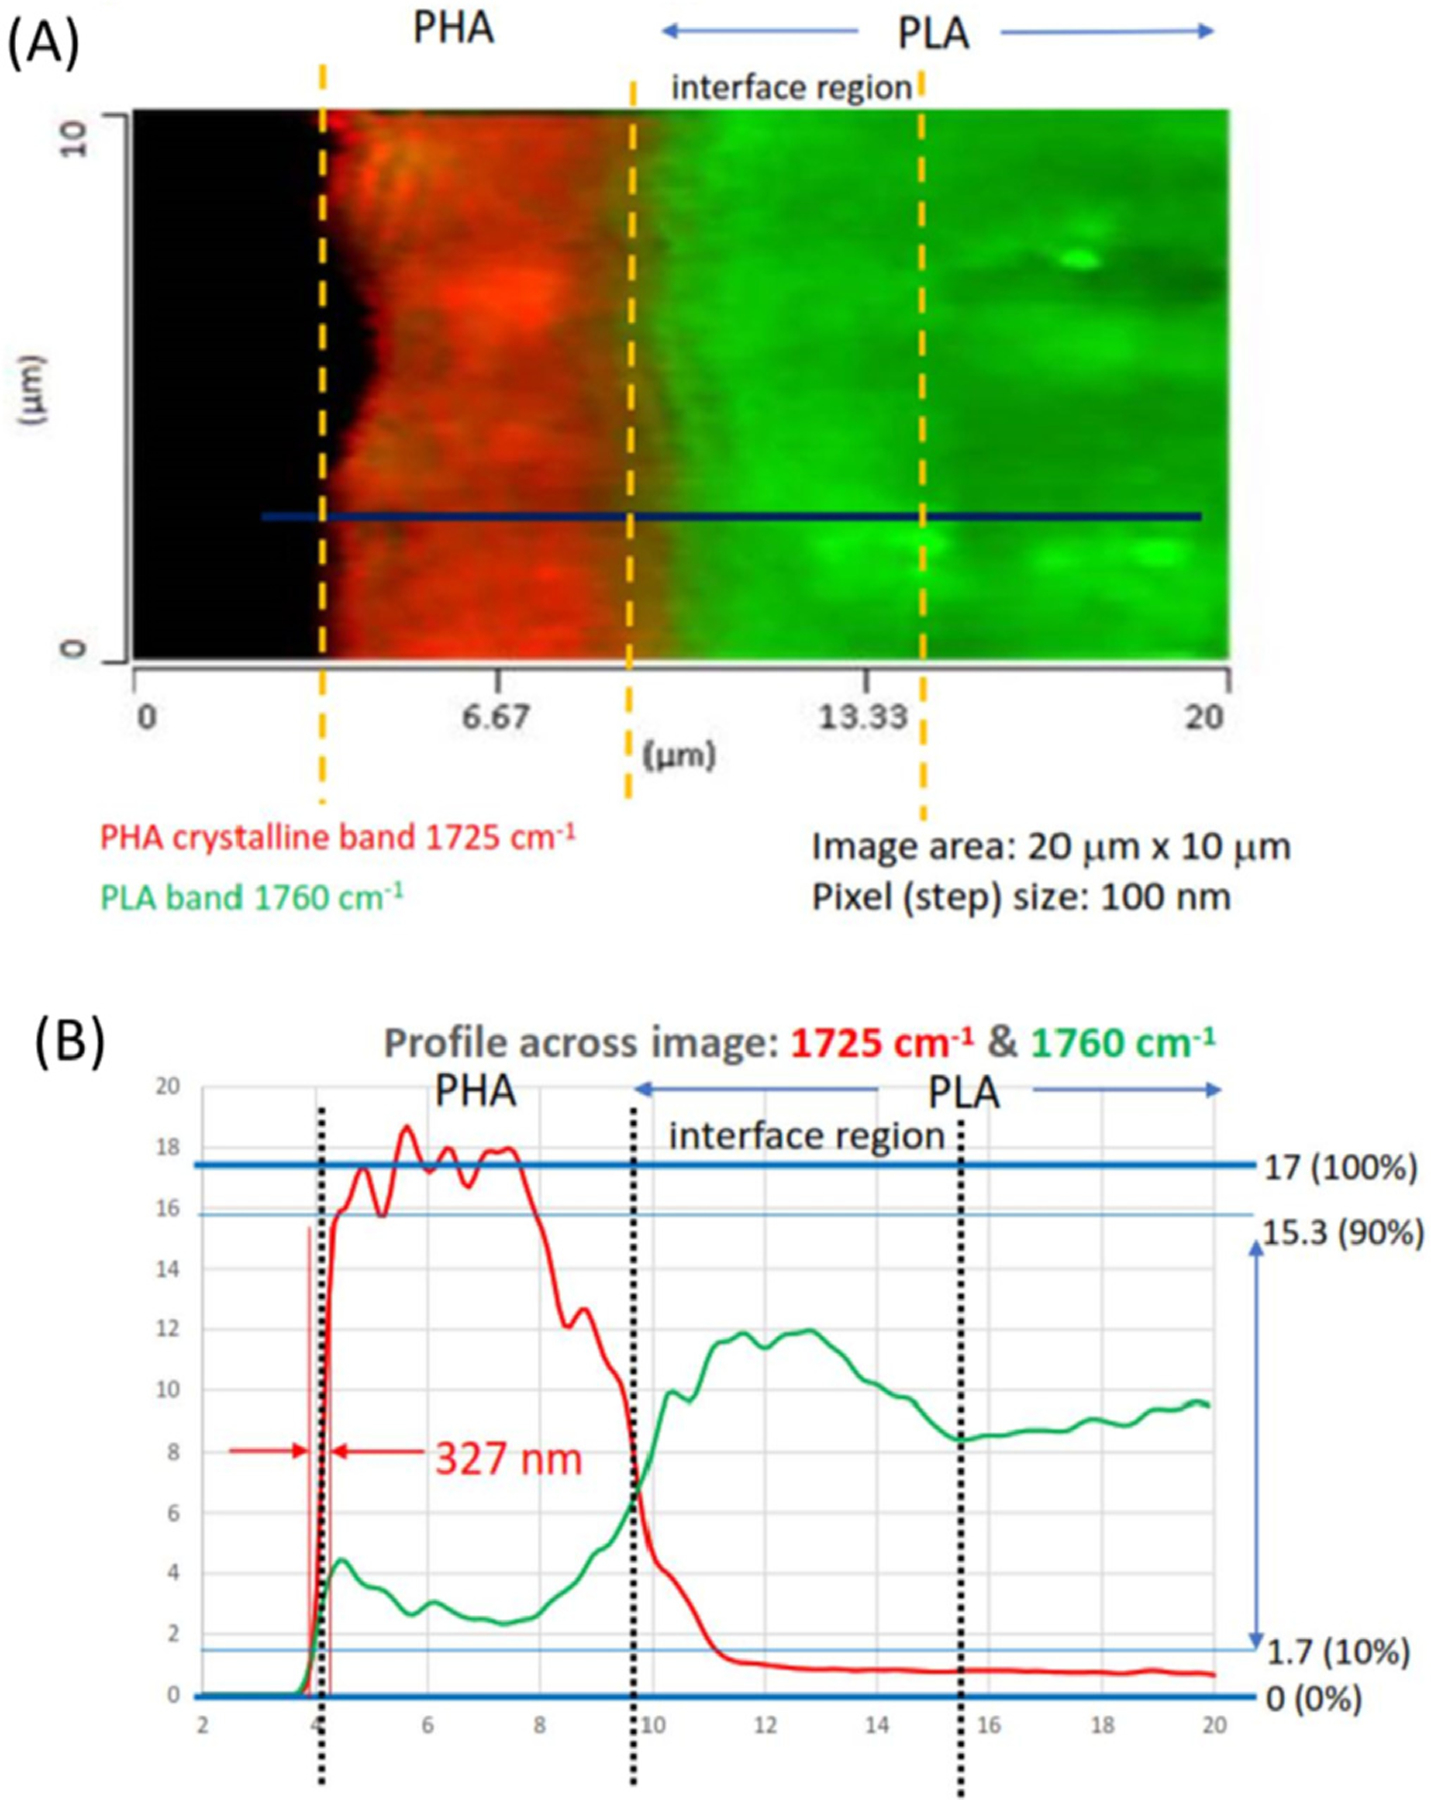
The fixed wavenumber image (A) and spectral intensity profiles (B) of the PHA/PLA laminate cross section represented by the O-PTIR carbonyl stretching bands at 1725 cm–1 for PHA and 1760 cm–1 for PLA.

The fixed wavenumber image (A) and spectral intensity profiles (B) of the PHA/PLA laminate cross section represented by the O-PTIR carbonyl stretching bands at 1725 cm–1 for PHA and 1760 cm–1 for PLA.