
Fig. 6.
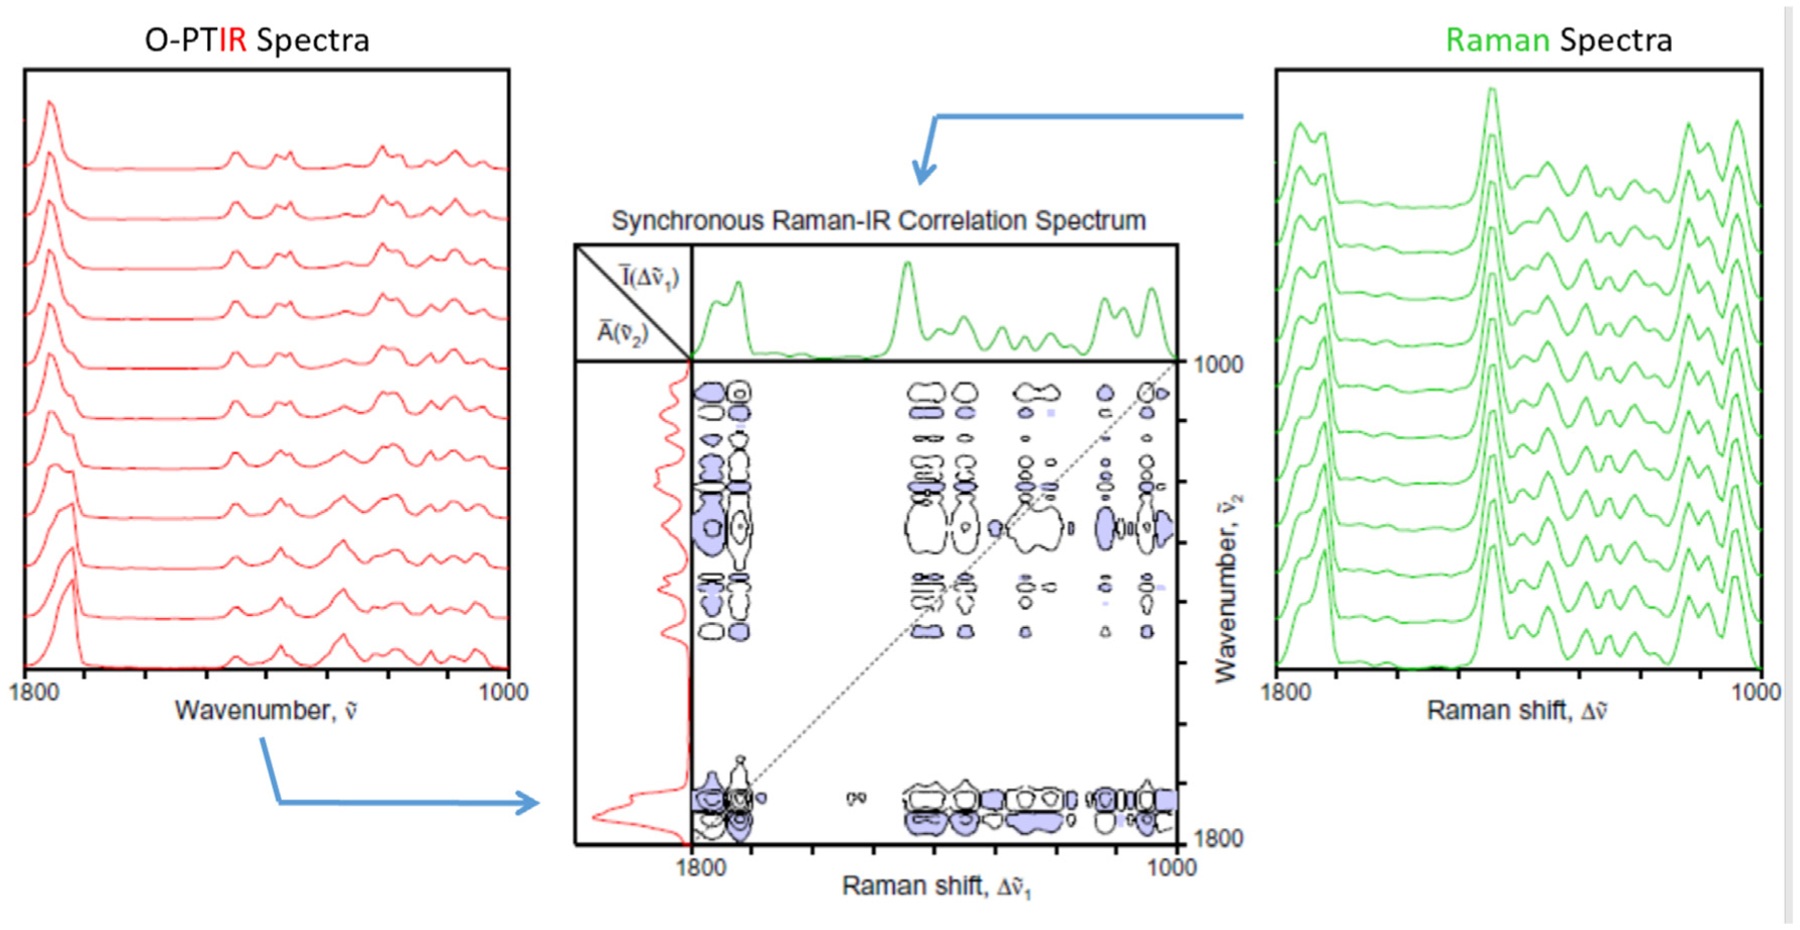
Synchronous hetero-spectral 2D correlation map (center) calculated using the simultaneously collected O-PTIR and Raman spectra (shown to the left and right, respectively) collected along a line across the boundary of the PHA/PLA laminate.
Official websites use .gov
A
.gov website belongs to an official
government organization in the United States.
Secure .gov websites use HTTPS
A lock (
) or https:// means you've safely
connected to the .gov website. Share sensitive
information only on official, secure websites.
Synchronous hetero-spectral 2D correlation map (center) calculated using the simultaneously collected O-PTIR and Raman spectra (shown to the left and right, respectively) collected along a line across the boundary of the PHA/PLA laminate.