
Figure 2. Luteolin-induced cytotoxicity and genotoxicity in human TK6 cells.
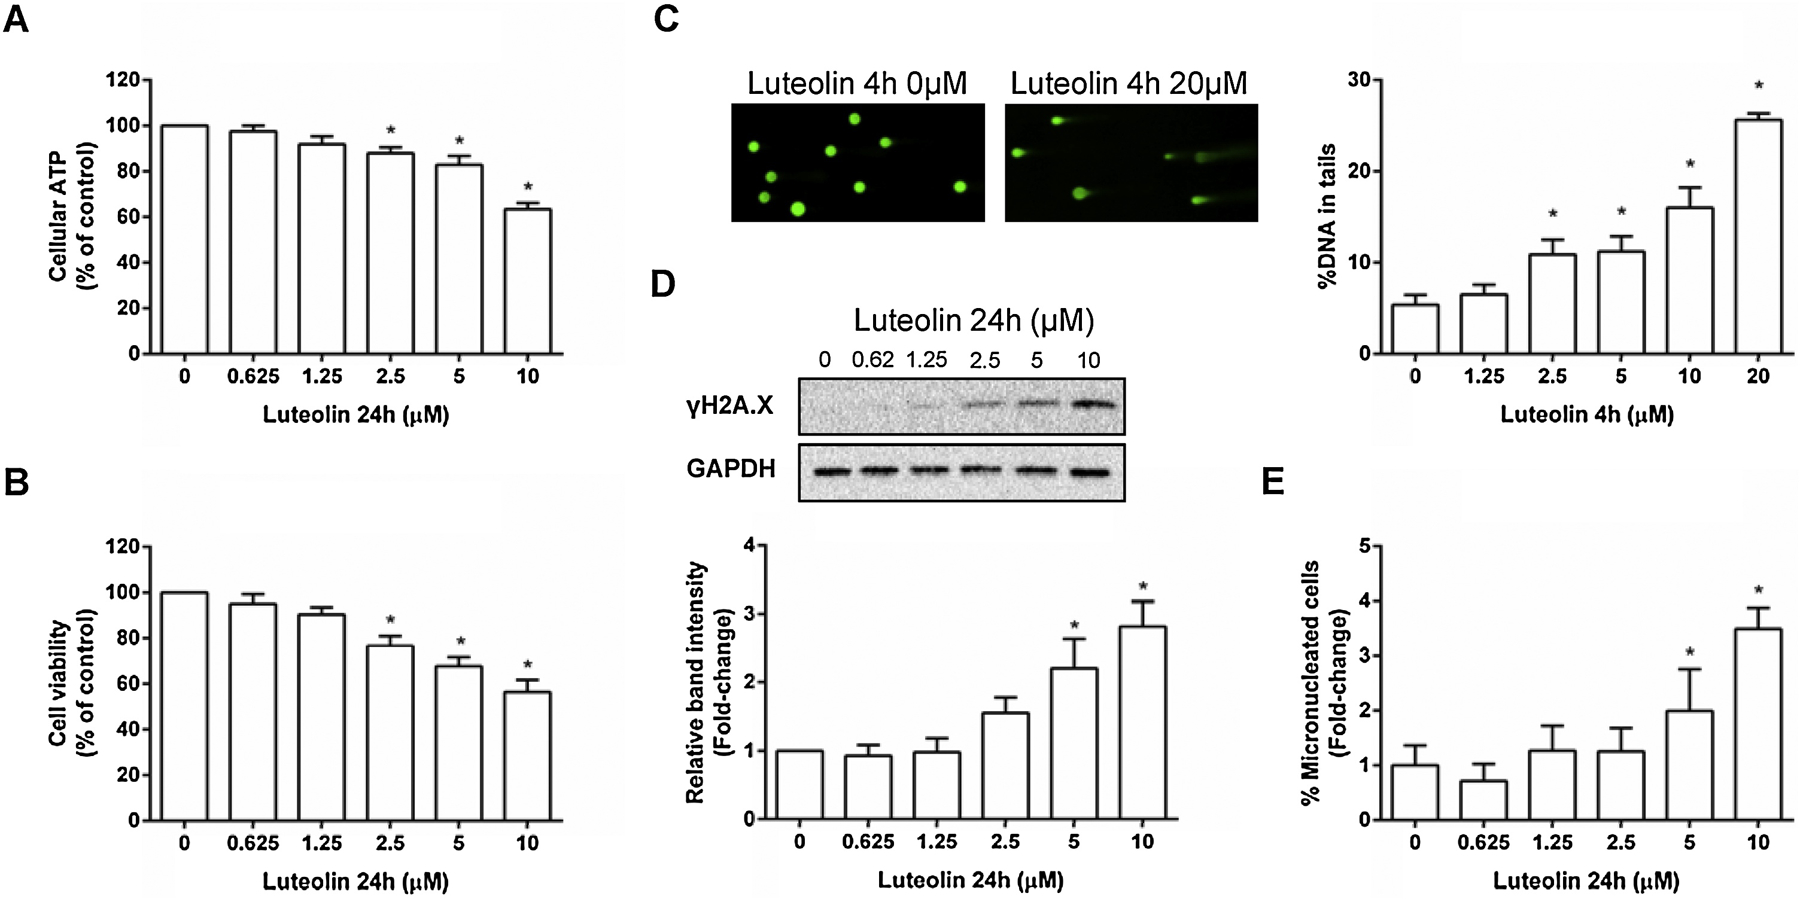
Cells were treated at the indicated concentrations for 24 h. The cellular ATP level (A), cell viability (B), and micronuclei (E) were determined by the CellTiter-Glo® assay, CellTiter-Blue® assay, and high-throughput micronucleus assay, respectively. Representative images are shown from one experiment for the alkaline comet assay after 4-h treatment (C) and Western blot of γH2A.X after 24-h treatment (D). The data represent the mean ± SD from three independent experiments (A, B, C, & E). Protein expression of γH2A.X levels was quantified and normalized to the amount of GAPDH, then expressed as the mean ± SD from three independent experiments (D). * indicates P < 0.05 comparing to the vehicle controls.